Get certified for free when you join Fabric Data Days 2026 and dive into Fabric, Power BI, SQL, AI, and other essential data skills.
Join nowJuly 7 - July 17 | Round 2 of the Power BI Dataviz World Championships. Don't miss your chance! Learn more
Hi,
The following code runs in RStudio and creates a table without issue
(dataset is a dataframe with 10 rows and 13 columns)
Solved! Go to Solution.
Hi @nxa03tm ,
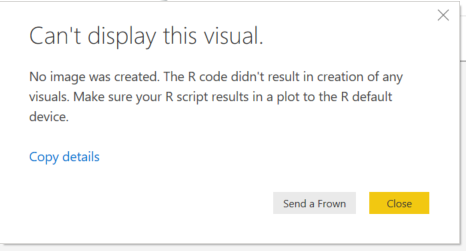
This is know issue in R and not related to PBID directly. R does not have support of exporting these graphs to graphic devices such as svg, png and even pdf.
in PBI we support png graphic device.
to export graph to png please follow this : https://github.com/rich-iannone/DiagrammeR/issues/133 (png file name should be '001.png')
Best regards,
Dina Ye
Hi @nxa03tm ,
This is know issue in R and not related to PBID directly. R does not have support of exporting these graphs to graphic devices such as svg, png and even pdf.
in PBI we support png graphic device.
to export graph to png please follow this : https://github.com/rich-iannone/DiagrammeR/issues/133 (png file name should be '001.png')
Best regards,
Dina Ye
Join us in Barcelona for FabCon and SQLCon, the Fabric, Power BI, SQL, and AI community event. Save €200 with code FABCMTY200.
Join Data Days 2026: 60 days of free live/on-demand sessions, challenges, study groups, and certification opportunities.
| User | Count |
|---|---|
| 27 | |
| 23 | |
| 18 | |
| 18 | |
| 15 |
| User | Count |
|---|---|
| 49 | |
| 44 | |
| 42 | |
| 39 | |
| 32 |