cancel
Showing results for 
Search instead for 
Did you mean: 

The Fabric community is now in read-only for platform upgrade. Learn more

Reply
ROG
Responsive Resident
Responsive Resident

Forecast built-in data format

Hello,


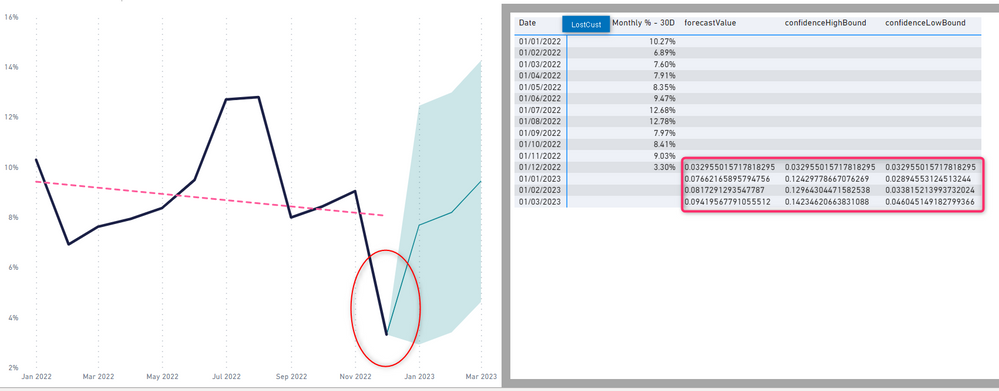
I'm using the built-in forecast in my model, and I'm wondering if it's possible to change the decimal numbers to percentage?

Also, the line chart shows the number of lost customer by month, so I don't understand why the big drop in December? It doesn't matter, if I add the zoom slider it's still showing the drop.


ROG_0-1670953200585.png


Thank you!


3 REPLIES 3
v-xiaotang
Community Support
Community Support

Hi @ROG 

Thanks for reaching out to us.

>> I'm wondering if it's possible to change the decimal numbers to percentage?

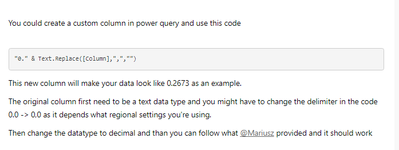
please refer to Solved: How to change column from decimal to percentages? - Microsoft Power BI Community

(1) solution 1

vxiaotang_0-1671009380275.png

(2) solution2

vxiaotang_1-1671009400031.png


Best Regards,

Community Support Team _Tang

If this post helps, please consider Accept it as the solution to help the other members find it more quickly.

ROG
Responsive Resident
Responsive Resident

Hi @v-xiaotang  thanks or your reply.


I know how to change decimal numbers to percentage, but those numbers on the charts were provided by the PBI AI. The forecast I'm using is a built-in featiure, but I would like to change it still to %. Thanks.

Just responding to get an alert if someone has an answer to this. I'm trying to figure out the same thing.

Helpful resources

Announcements
FabCon and SQLCon Barcelona 2026

FabCon & SQLCon – Barcelona 2026

Join us in Barcelona for FabCon and SQLCon, the Fabric, Power BI, SQL, and AI community event. Save €200 with code FABCMTY200.

Power BI DataViz World Championships carousel

Power BI DataViz World Championships - June 2026

A new Power BI DataViz World Championship is coming this June! Don't miss out on submitting your entry.