cancel
Showing results for 
Search instead for 
Did you mean: 

July 7 - July 17 | Round 2 of the Power BI Dataviz World Championships. Don't miss your chance! Learn more

Reply
RAHEEL
Helper I
Helper I

Fixed Measure Calculation

Hi All, 

I have dataset with 3columns i.e. (Group, Category,Resource ID)


groupcategoryresource ID
GACA1254
GACA2568
GACA6359
GBCA3598
GBCB1478
GCCA9852


I want to create 2different measures. i.e. counts by Group & Counts by Category;

WHEN i will drop groupcount measure without any filter on the canvas it should give me 6.

WHEN i will drop categorycount measure without any filter on the canvas it should give me 6.


However, when I will drop groupcount and categorycount  together and there is a slicer on catergory in the same canvas e.g.'CA" , it should give me count of 6 for groupcount measure and 5 for categorycount measure. 

In other words I want only same attribute slicer should change the number of that attribute otherwise it should display static number always. 


e.g. groupcount should give me 2 when i select GB from slicer and there is no slicer of category so categorycount should still reflect 6.


Kindly provide me with the measure formula 🙂


Regards,

Raheel 


2 ACCEPTED SOLUTIONS
miltenburger
Helper V
Helper V

Hi @RAHEEL


This is kind a easy:


group = COUNTROWS('tablename'[group])

category = COUNTROWS('tablename'[category])

When you have a filter and select CA, it should give you 5 for category

etc.


Kind regards

View solution in original post

Anonymous
Not applicable

Dear @RAHEEL,


You can follow solution of @miltenburger.


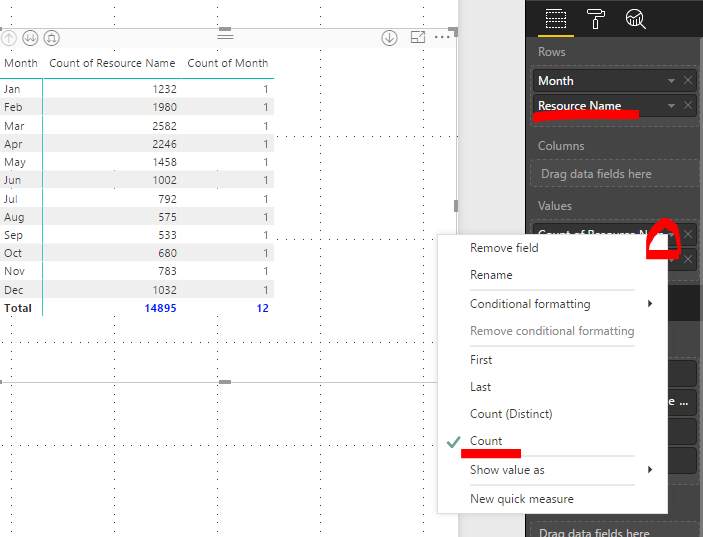
Or you can simply drag column Category into Values field, choose Count (or Count Distinct).

Then drage column Group as the same Category.

Then change the name.


Like this:

image.png

View solution in original post

3 REPLIES 3
Anonymous
Not applicable

Dear @RAHEEL,


You can follow solution of @miltenburger.


Or you can simply drag column Category into Values field, choose Count (or Count Distinct).

Then drage column Group as the same Category.

Then change the name.


Like this:

image.png

miltenburger
Helper V
Helper V

Hi @RAHEEL


This is kind a easy:


group = COUNTROWS('tablename'[group])

category = COUNTROWS('tablename'[category])

When you have a filter and select CA, it should give you 5 for category

etc.


Kind regards

Hi @miltenburger

COUNTROWS is not taking columnname as input..it is only taking tablename as input

Helpful resources

Announcements
FabCon and SQLCon Barcelona 2026

FabCon & SQLCon – Barcelona 2026

Join us in Barcelona for FabCon and SQLCon, the Fabric, Power BI, SQL, and AI community event. Save €200 with code FABCMTY200.

60 days of Data Days Carousel

Data Days 2026

Join Data Days 2026: 60 days of free live/on-demand sessions, challenges, study groups, and certification opportunities.

Power BI DataViz World Championships carousel

Power BI DataViz World Championships - June 2026

A new Power BI DataViz World Championship is coming this June! Don't miss out on submitting your entry.

Top Solution Authors