This is best Fabric, Power BI, SQL and AI community event. How do we know? The last event sold out! Save €200 with code FABCMTY200.
Register nowA new Data Days event is coming soon! This time we’re going bigger than ever. Fabric, Power BI, SQL, AI and more. Don't miss out.
Hi all,
I'm trying my luck again as my previous post might've been complicated. I'll try to simplify this post.
I have created the below Variable - to produce & isolate a list of Customers that are based in City = Hobart.
VAR HOBART =
CALCULATETABLE (
SELECTCOLUMNS (
VALUES (Customer),
"City", Customer[City],
"Code", Customer[Customer Code]
),
Customer[City] = "Hobart"
)
I have then created another Variable for my Product Table that Filters for Red or Black Color.
VAR REDORBLACK =
FILTER(
VALUES('Product'[Color]),
OR(
'Product'[Color] = "Red",
'Product'[Color] = "Black"
)
)
I now want to produce an output where I am only looking for Customers that are based in Hobart that have Products Red or Black. Basically, VAR HOBART to Filter VAR REDORBLACK. The output should look something like.
| City | Customer Code | Red or Black Count |
| Hobart | 1 | 3 |
| Hobart | 2 | 10 |
| Hobart | 9 | 1 |
I am using a Published dataset with a lot of rows for Customers table & as a result, I'm trying to create a Variable for Hobart to avoid errors with processsing millions of Rows.
Hope someone can provide some suggestions.
Thanks.
Solved! Go to Solution.
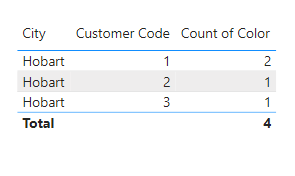
Hi @arnomics ,
You can use viual filter:
Final output:
Best Regards,
Jianbo Li
If this post helps, then please consider Accept it as the solution to help the other members find it more quickly.
Hi @arnomics ,
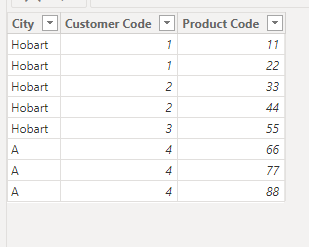
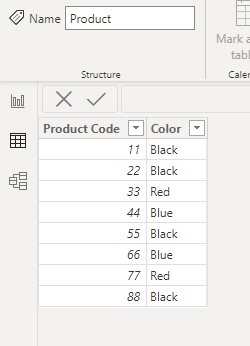
Based on your description, I have created a simple sample:
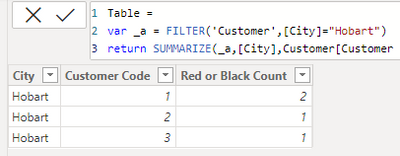
Please try:
Table =
var _a = FILTER('Customer',[City]="Hobart")
return SUMMARIZE(_a,[City],Customer[Customer Code],"Red or Black Count",CALCULATE(COUNT('Product'[Product Code]),FILTER('Product',[Color] in {"Red","Black"})))
Output:
Best Regards,
Jianbo Li
If this post helps, then please consider Accept it as the solution to help the other members find it more quickly.
Thanks for your reply @v-jianboli-msft
Since I am using a Published dataset I cannot create a Table in the Data Model. But instead I was hoping to create a Measure that would allow me to drag & drop Columns from the table different tables with the Measure that I created.
Hi @arnomics ,
You can use viual filter:
Final output:
Best Regards,
Jianbo Li
If this post helps, then please consider Accept it as the solution to help the other members find it more quickly.
@arnomics , Simple create one measure or two measures
calculate(countrows(Table), filter(Product, Product[Color] in {"Red", "Black"} ))
if you create a new table, that table should join to your fact and then use countrows(table) measure
Thanks for your reply @amitchandak
The main issue is that I'm using a Published Dataset and adding New Tables, Columns etc. is greyed out. It stops me from doing lot of things that would make my life easier.
Check out the May 2026 Power BI update to learn about new features.
Sign up to receive a private message when registration opens and key events begin.
If you have recently started exploring Fabric, we'd love to hear how it's going. Your feedback can help with product improvements.
| User | Count |
|---|---|
| 29 | |
| 25 | |
| 25 | |
| 21 | |
| 14 |
| User | Count |
|---|---|
| 61 | |
| 50 | |
| 25 | |
| 20 | |
| 20 |