Get certified for free when you join Fabric Data Days 2026 and dive into Fabric, Power BI, SQL, AI, and other essential data skills.
Join nowJuly 28 - August 9 | Final Round of the Power BI Dataviz World Championships. This is your chance. Learn more
Hi,
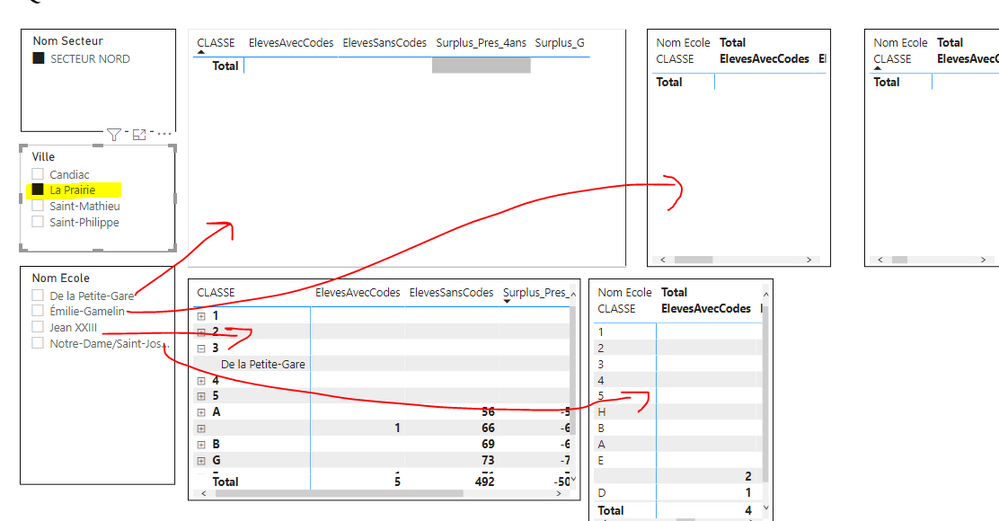
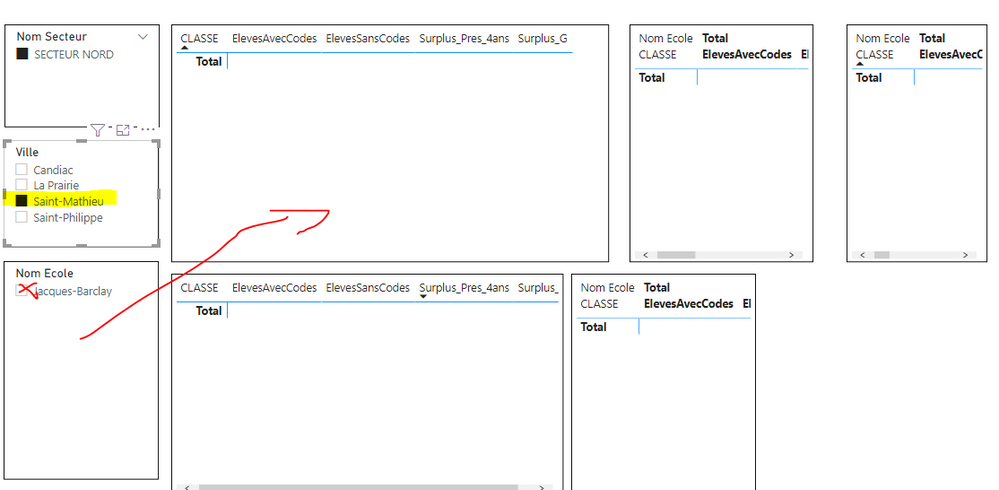
I would like to display some matrix for each "Ville" I check. How can I use the same matrix to filter different villes?
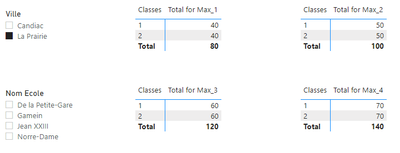
If I check one "Ville" and one "Nom Ecole" is shows one matrix with the right values but What I need is show all the "Nom Ecoles" by "Ville" at the same time in different arrays. Thanks
Solved! Go to Solution.
You can try these steps.
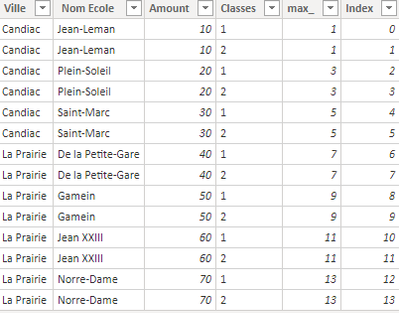
1 Add Index to the table in Power Query
2 Get max value for every Nom Ecole in every Ville
max_ = MAXX(FILTER('Table','Table'[Ville]=EARLIER('Table'[Ville])&&'Table'[Nom Ecole]=EARLIER('Table'[Nom Ecole])),'Table'[Index])
3 Rank by the max value
rank_ = RANKX(FILTER('Table','Table'[Ville]=EARLIER('Table'[Ville])),'Table'[max_],,ASC,Dense)
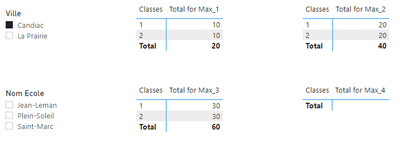
4 Create Measures for every matrices
Total for Max_1 = CALCULATE(SUM('Table'[Amount]),FILTER('Table','Table'[Ville]=SELECTEDVALUE('Table'[Ville])&&'Table'[rank_]=1))
Total for Max_2 = CALCULATE(SUM('Table'[Amount]),FILTER('Table','Table'[Ville]=SELECTEDVALUE('Table'[Ville])),'Table'[rank_]=2)
...
For more details, you can refer the attached pbix file.
Best Regards
Caiyun Zheng
Is that the answer you're looking for? If this post helps, then please consider Accept it as the solution to help the other members find it more quickly.
I really appreciate the measure you created for me. They worked excellent!!
You can try these steps.
1 Add Index to the table in Power Query
2 Get max value for every Nom Ecole in every Ville
max_ = MAXX(FILTER('Table','Table'[Ville]=EARLIER('Table'[Ville])&&'Table'[Nom Ecole]=EARLIER('Table'[Nom Ecole])),'Table'[Index])
3 Rank by the max value
rank_ = RANKX(FILTER('Table','Table'[Ville]=EARLIER('Table'[Ville])),'Table'[max_],,ASC,Dense)
4 Create Measures for every matrices
Total for Max_1 = CALCULATE(SUM('Table'[Amount]),FILTER('Table','Table'[Ville]=SELECTEDVALUE('Table'[Ville])&&'Table'[rank_]=1))
Total for Max_2 = CALCULATE(SUM('Table'[Amount]),FILTER('Table','Table'[Ville]=SELECTEDVALUE('Table'[Ville])),'Table'[rank_]=2)
...
For more details, you can refer the attached pbix file.
Best Regards
Caiyun Zheng
Is that the answer you're looking for? If this post helps, then please consider Accept it as the solution to help the other members find it more quickly.
Join us in Barcelona for FabCon and SQLCon, the Fabric, Power BI, SQL, and AI community event. Save €200 with code FABCMTY200.
If you love stickers, then you will definitely want to check out our community sticker challenge, Barcelona edition!
Check out the July 2026 Power BI update to learn about new features.
| User | Count |
|---|---|
| 30 | |
| 28 | |
| 25 | |
| 24 | |
| 16 |
| User | Count |
|---|---|
| 48 | |
| 32 | |
| 17 | |
| 16 | |
| 16 |