cancel
Showing results for 
Search instead for 
Did you mean: 

A new Data Days event is coming soon! This time we’re going bigger than ever. Fabric, Power BI, SQL, AI and more. Don't miss out.

Reply
Anonymous
Not applicable

Filtering assistance

All,


I am sure there is an easy solution to this problem but I cannot find it! Anyways here goes:


We have a database that contains transaction lines, for simplicity we have 3 columns, sub name, group name, and sale value. We want to be able to create a visual on a page that shows all the group names with total sales divided by sub name. We can do this but we would like to filter that so we see only totals above 1000000. However when we filter by sales value we only get results back where the line is above 1000000 not the overall total for that name.


We are hoping to just use DAX or equivalent rather than create a new table,


As I said this surely must be easy but I cannot seem to get it to work.

Thanks

Matt

1 ACCEPTED SOLUTION
Sean
Community Champion
Community Champion

@Anonymous Create a Group Sales Measure - which calculates the Total at the Group Level!

Assuming that is the Total level you want to filter Smiley Happy You can of course change this to Sub Name
 

Group Sales Measure =
CALCULATE (
    SUM ( 'Table'[Sale Value] ),
    ALLEXCEPT ( 'Table', 'Table'[Group Name] )
)


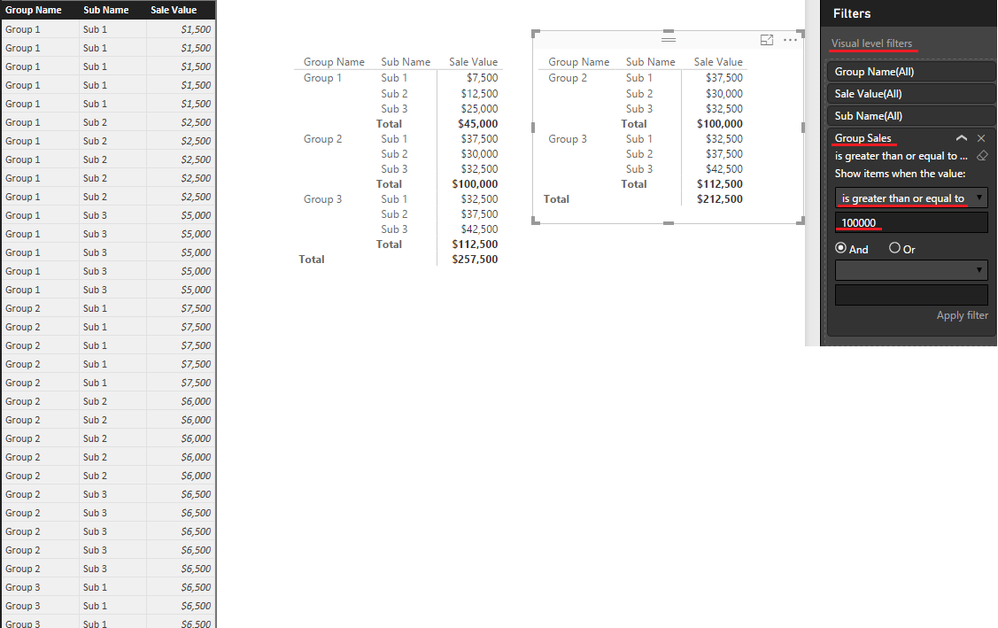
Drag this Measure to the Visual level filters and select Show items when the value is: greater than or equal to type 100000


And here's the result:


DAX - Show only Total Sales over 100K.png

View solution in original post

2 REPLIES 2
Sean
Community Champion
Community Champion

@Anonymous Create a Group Sales Measure - which calculates the Total at the Group Level!

Assuming that is the Total level you want to filter Smiley Happy You can of course change this to Sub Name


Group Sales Measure =
CALCULATE (
    SUM ( 'Table'[Sale Value] ),
    ALLEXCEPT ( 'Table', 'Table'[Group Name] )
)


Drag this Measure to the Visual level filters and select Show items when the value is: greater than or equal to type 100000


And here's the result:


DAX - Show only Total Sales over 100K.png

kcantor
Community Champion
Community Champion

Create a calculation for the visual.

'Type A transactions' = CALCULATE([Total Sales], [Line Amount]>1000000) Or something similar should work.

this shows using the filter within the calculation. Other lines will be blank. You will need lookup tables for the sub name, group name, and date so that you can populate the axis appropriately.


Did I answer your question? Mark my post as a solution!

Proud to be a Super User!


Helpful resources

Announcements
May Power BI Update Carousel

Power BI Monthly Update - May 2026

Check out the May 2026 Power BI update to learn about new features.

Fabric SQL PBI Data Days

Data Days 2026 coming soon!

Sign up to receive a private message when registration opens and key events begin.

New to Fabric survey Carousel

New to Fabric Survey

If you have recently started exploring Fabric, we'd love to hear how it's going. Your feedback can help with product improvements.

Power BI DataViz World Championships carousel

Power BI DataViz World Championships - June 2026

A new Power BI DataViz World Championship is coming this June! Don't miss out on submitting your entry.