Get Fabric or SQL Certified for Free.
Get certified for free when you join Fabric Data Days 2026 and dive into Fabric, Power BI, SQL, AI, and other essential data skills.
Join now- Power BI forums
- Get Help with Power BI
- Desktop
- Service
- Report Server
- Power Query
- Mobile Apps
- Developer
- DAX Commands and Tips
- Custom Visuals Development Discussion
- Health and Life Sciences
- Power BI Spanish forums
- Translated Spanish Desktop
- Training and Consulting
- Instructor Led Training
- Dashboard in a Day for Women, by Women
- Galleries
- Data Stories Gallery
- Themes Gallery
- Contests Gallery
- QuickViz Gallery
- Quick Measures Gallery
- Visual Calculations Gallery
- Fabric Apps Gallery
- Notebook Gallery
- Translytical Task Flow Gallery
- TMDL Gallery
- R Script Showcase
- Webinars and Video Gallery
- Ideas
- Custom Visuals Ideas (read-only)
- Issues
- Issues
- Events
- Upcoming Events
July 28 - August 9 | Final Round of the Power BI Dataviz World Championships. This is your chance. Learn more
- Power BI forums
- Forums
- Get Help with Power BI
- Desktop
- Filtered result name
- Subscribe to RSS Feed
- Mark Topic as New
- Mark Topic as Read
- Float this Topic for Current User
- Bookmark
- Subscribe
- Printer Friendly Page


- Mark as New
- Bookmark
- Subscribe
- Mute
- Subscribe to RSS Feed
- Permalink
- Report Inappropriate Content
Filtered result name
Hi Community
I have problem with filtering the data.
My data has customer ID, customer name, customer branch and a number of other dimensions.
I use card visual for displaying these dimensions and I have filters on all of them.
When I select definite customer id, visual displays related customer name, branch name and others. It is ok.
But when nothing is selected, all dimensions returns first one in the list.
I want do display definite wording "ALL" for all dimensions when nothing is selected. Please help me with formulation.
Solved! Go to Solution.


- Mark as New
- Bookmark
- Subscribe
- Mute
- Subscribe to RSS Feed
- Permalink
- Report Inappropriate Content
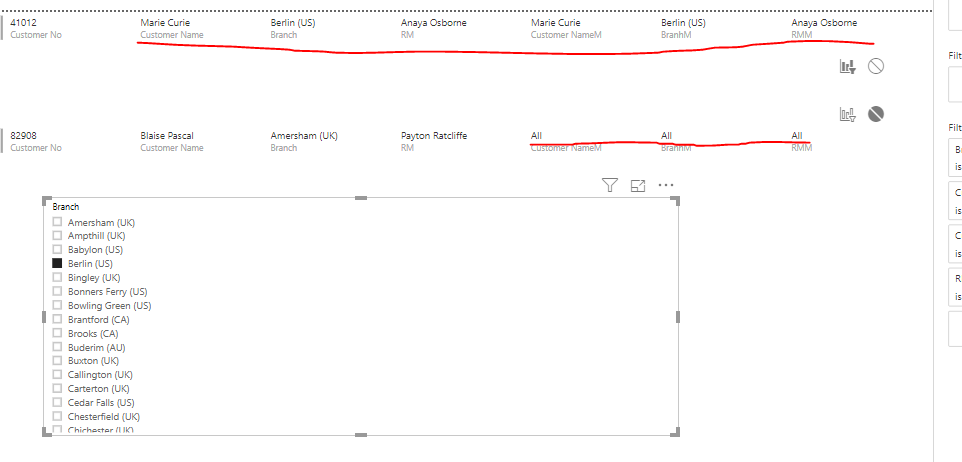
Hi @OSS ,
To create three meausre to work on it.
BranhM =
VAR countrall =
    CALCULATE ( COUNTROWS ( 'Customer List' ), ALL ( 'Customer List' ) )
VAR countr =
    CALCULATE ( COUNTROWS ( 'Customer List' ), ALLSELECTED ( 'Customer List' ) )
RETURN
    IF ( countr = countrall, "All", MAX ( 'Customer List'[Branch] ) )
Customer NameM =
VAR countrall =
    CALCULATE ( COUNTROWS ( 'Customer List' ), ALL ( 'Customer List' ) )
VAR countr =
    CALCULATE ( COUNTROWS ( 'Customer List' ), ALLSELECTED ( 'Customer List' ) )
RETURN
    IF ( countr = countrall, "All", MAX ( 'Customer List'[Customer Name] ) )
RMM =
VAR countrall =
    CALCULATE ( COUNTROWS ( 'Customer List' ), ALL ( 'Customer List' ) )
VAR countr =
    CALCULATE ( COUNTROWS ( 'Customer List' ), ALLSELECTED ( 'Customer List' ) )
RETURN
    IF ( countr = countrall, "All", MAX ( 'Customer List'[RM] ) )
If this post helps, then please consider Accept it as the solution to help the others find it more quickly.


- Mark as New
- Bookmark
- Subscribe
- Mute
- Subscribe to RSS Feed
- Permalink
- Report Inappropriate Content
Hi,
Try this measure
=IF(HASONEVALUE(Data[Customer ID]),VALUES(Data[Client]),"All")
Hope this helps.
Regards,
Ashish Mathur
http://www.ashishmathur.com
https://www.linkedin.com/in/excelenthusiasts/
- Mark as New
- Bookmark
- Subscribe
- Mute
- Subscribe to RSS Feed
- Permalink
- Report Inappropriate Content
@Ashish_Mathur Thank you for your response, but unfortunately I have tried this formula and it doesn't return exactly what I am looking for.
- Mark as New
- Bookmark
- Subscribe
- Mute
- Subscribe to RSS Feed
- Permalink
- Report Inappropriate Content
Hi @OSS ,
Could you please share your sample data and excepted result to me if you don't have any Confidential Information. Please upload your files to One Drive and share the link here.
If this post helps, then please consider Accept it as the solution to help the others find it more quickly.
- Mark as New
- Bookmark
- Subscribe
- Mute
- Subscribe to RSS Feed
- Permalink
- Report Inappropriate Content
@v-frfei-msft I have uploaded the sample to one drive.
https://1drv.ms/u/s!Anq8qDsGb04laQas2uox-rnt5wE?e=GFu9BP
I visualise my data with the multiple row card.
I want to write formula and make first row different untill some filter is applied. Actually I use this visual like one row visual and I want to write "ALL" for all dimensions untill definite filter is applied.
May be this is not possible with the multi row card visual. Then please advice me how can I achive this goal.
Best Regards
- Mark as New
- Bookmark
- Subscribe
- Mute
- Subscribe to RSS Feed
- Permalink
- Report Inappropriate Content
Hi @OSS ,
To create three meausre to work on it.
BranhM =
VAR countrall =
    CALCULATE ( COUNTROWS ( 'Customer List' ), ALL ( 'Customer List' ) )
VAR countr =
    CALCULATE ( COUNTROWS ( 'Customer List' ), ALLSELECTED ( 'Customer List' ) )
RETURN
    IF ( countr = countrall, "All", MAX ( 'Customer List'[Branch] ) )
Customer NameM =
VAR countrall =
    CALCULATE ( COUNTROWS ( 'Customer List' ), ALL ( 'Customer List' ) )
VAR countr =
    CALCULATE ( COUNTROWS ( 'Customer List' ), ALLSELECTED ( 'Customer List' ) )
RETURN
    IF ( countr = countrall, "All", MAX ( 'Customer List'[Customer Name] ) )
RMM =
VAR countrall =
    CALCULATE ( COUNTROWS ( 'Customer List' ), ALL ( 'Customer List' ) )
VAR countr =
    CALCULATE ( COUNTROWS ( 'Customer List' ), ALLSELECTED ( 'Customer List' ) )
RETURN
    IF ( countr = countrall, "All", MAX ( 'Customer List'[RM] ) )
If this post helps, then please consider Accept it as the solution to help the others find it more quickly.
- Mark as New
- Bookmark
- Subscribe
- Mute
- Subscribe to RSS Feed
- Permalink
- Report Inappropriate Content
dear @v-frfei-msft
I have one more question related with this issue.
Taking into consideration the same sample, I want to add one another dimension. I want to add 'Country' dimension which ic connected with my main table via 'Branch' dimension. While adding 'Country' it returns the same input for every selection.
| Branch | Country |
| New Smyrna Beach (US) | US |
| Saguenay (CA) | CA |
| Amersham (UK) | UK |
| Sweetwater (US) | US |
| Stratford (CA) | CA |
| Neenah (US) | US |
| Chichester (UK) | UK |
| Prairie du Chien (US) | US |
| Vancouver (US) | US |
| Houghton Regis (UK) | UK |
| Snodland (UK) | UK |
| Grand Haven (US) | US |
| Cedar Falls (US) | US |
- Mark as New
- Bookmark
- Subscribe
- Mute
- Subscribe to RSS Feed
- Permalink
- Report Inappropriate Content
Thank you very much. It is exactly what I am looking for.
You are great!
Best Regards

Helpful resources

Fabric Community Sticker Challenge - Barcelona 2026
If you love stickers, then you will definitely want to check out our community sticker challenge, Barcelona edition!

Power BI Monthly Update - July 2026
Check out the July 2026 Power BI update to learn about new features.

Power BI DataViz World Championships - June 2026
A new Power BI DataViz World Championship is coming this June! Don't miss out on submitting your entry.

| User | Count |
|---|---|
| 30 | |
| 28 | |
| 23 | |
| 21 | |
| 19 |


| User | Count |
|---|---|
| 40 | |
| 31 | |
| 18 | |
| 18 | |
| 15 |


