cancel
Showing results for 
Search instead for 
Did you mean: 

July 7 - July 17 | Round 2 of the Power BI Dataviz World Championships. Don't miss your chance! Learn more

Reply
Josepatwentysix
Frequent Visitor

Filter data, difference

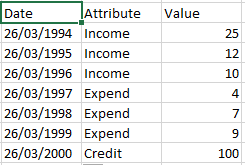
Hello, I'm trying to make a new measure with my data, but I can't understand how to filter my data based on the attribute of the other column. For example I have one column of Values, where is my numerical data, so I have another one where I have the attribute's. In the presente case I need to filter Income and Expends respectively and make a differences between these two values.


Untitled.png

4 REPLIES 4
Anonymous
Not applicable

You need to make use of the Filter function within your measure.  Something like:

My Measure = SumX(Filter('The Table', 'The Table'[Attribute] = "AttributeFilter"), [Value])

'The Table' is the name of the table you are looking at
[Attribute] is the column with the attribute data to filter on
"AttributeFilter" is the string you want to filter by (i.e. Income)
[Value] is the column with the values to sum total.


Ross,


That works when you have known attributes. In my case I have ten different attributes(Attribute names are Scenario 1, Scenario 2...). I want to calculate the difference between two selected scenarios while using a slicer. So if the slicer has Scenario 2 and Scenario 10 selected I need a column which does Scenario 2.Value - Scenario 10.Value


Don't mean to hijack the thread but I believe my query is an extension of the original problem.


I solved it. This is how I did it.


As mentioned above I have upto ten different attributes ranging from Scenario 1 to Scenario 10 which are basically different forecasting models. My condundrum was to get the difference between any two selected Scenarios (ex: Scenario 1.Value - Scenario 2.Value) when those values are picked from a slicer. The scenario names are in the 'ScenariosModels' table under the 'Scenario' column and are called "Scenario 1", "Scenario 2" etc.


I created two tables first, called the first table 'First Pick' and called the second table 'Second Pick'. Both the tables have ten rows of data from 1 - 10 as text values and have column names 'First Pick' for the first table and 'Second Pick' for the second table.


I then calculated my switches as follows (I have only added two Scenarios for brevity)


First Pick switch = Switch(Values('FirstPick'[First Pick]),"1","Scenario 1","2","Scenario 2")


Second Pick switch = Switch(Values('SecondPick'[Second Pick]),"1","Scenario 1","2","Scenario 2")


I then calculated the variance between two difference scenarios as a measure


Variance of scenarios= sumx(Filter('ScenarioModels','ScenarioModels'[Scenarios]=[First Pick switch]),[Total Quantity]) - sumx(Filter('ScenarioModels','ScenarioModels'[Scenarios]=[Second Pick switch]),[Total Quantity])


I then dragged 'FirstPick'[First Pick] and 'SecondPick'[Second Pick] columns into the canvas and converted them into a slicer. I then selected my relevant scenarios and plotted 'Variance of scenarios'.


This method works and easy to set up if you have a few scenarios, in my case the most I will be dealing with is about 10. If it is more (say 50) than then it is not an elegant solution as you have to manually update the logic in the switches for 50 of them. Maybe some one has a more elegant solution ?

Capstone
Resolver I
Resolver I

I'm in a similar situation and need the solution as well. If I manage to solve it, I will post the result here, please do the same if you find any solutions. Cheers.

Helpful resources

Announcements
FabCon and SQLCon Barcelona 2026

FabCon & SQLCon – Barcelona 2026

Join us in Barcelona for FabCon and SQLCon, the Fabric, Power BI, SQL, and AI community event. Save €200 with code FABCMTY200.

60 days of Data Days Carousel

Data Days 2026

Join Data Days 2026: 60 days of free live/on-demand sessions, challenges, study groups, and certification opportunities.

Power BI DataViz World Championships carousel

Power BI DataViz World Championships - June 2026

A new Power BI DataViz World Championship is coming this June! Don't miss out on submitting your entry.

Top Solution Authors