Get certified for free when you join Fabric Data Days 2026 and dive into Fabric, Power BI, SQL, AI, and other essential data skills.
Join nowJuly 7 - July 17 | Round 2 of the Power BI Dataviz World Championships. Don't miss your chance! Learn more
Mates,
My data is in below structure,
| EmpName | StartDate | DateEndate | 2015 | 2016 | 2017 | 2018 | 2019 |
| Emp1 | 2/25/2018 | 3/31/2019 | 1 | 1 | 1 | 1 | 1 |
| Emp2 | 4/19/2015 | 22/12/2018 | 1 | 1 | 1 | 1 | 1 |
| Emp3 | 10/12/2015 | 15/08/2017 | 1 | 1 | 1 | 1 | 1 |
But, I want to see the the data as below,
| EmpName | StartDate | DateEndate | 2015 | 2016 | 2017 | 2018 | 2019 |
| Emp1 | 2/25/2018 | 3/31/2019 | 1 | 1 | |||
| Emp2 | 4/19/2015 | 22/12/2018 | 1 | 1 | 1 | 1 | |
| Emp3 | 10/12/2015 | 15/08/2017 | 1 | 1 | 1 |
Flag (1) for each employee based on their Year(Min StartDate & Max EndDate). If both Years are same, then Flag should appear only in that respective Year. If StartDate & EndDate are in different Years, then Flag should spread across all the Years.
I am trying to figure out if there is a way to compare column value from StartDate with Header and generate the flag if it matches. Appreciate any help!
Solved! Go to Solution.
hi, @slanka
You could try this way in Edit Queries:
let
Source = Table.FromRows(Json.Document(Binary.Decompress(Binary.FromText("i45Wcs0tMFTSUTLSNzLVNzIwtACyjfWNDUFsSyDbEAPH6oA1GQE5JvqGliCFpiAJoAlGMBNw6jIGcQz0DY1g2gws9A3BFptj1xYLAA==", BinaryEncoding.Base64), Compression.Deflate)), let _t = ((type text) meta [Serialized.Text = true]) in type table [EmpName = _t, StartDate = _t, DateEndate = _t, #"2015" = _t, #"2016" = _t, #"2017" = _t, #"2018" = _t, #"2019" = _t]),
#"Changed Type" = Table.TransformColumnTypes(Source,{{"EmpName", type text}, {"StartDate", type date}, {"DateEndate", type date}, {"2015", Int64.Type}, {"2016", Int64.Type}, {"2017", Int64.Type}, {"2018", Int64.Type}, {"2019", Int64.Type}}),
#"Removed Columns" = Table.RemoveColumns(#"Changed Type",{"2015", "2016", "2017", "2018", "2019"}),
#"Inserted Year" = Table.AddColumn(#"Removed Columns", "Year", each Date.Year([StartDate]), Int64.Type),
#"Renamed Columns" = Table.RenameColumns(#"Inserted Year",{{"Year", "StartYear"}}),
#"Inserted Year1" = Table.AddColumn(#"Renamed Columns", "Year", each Date.Year([DateEndate]), Int64.Type),
#"Renamed Columns1" = Table.RenameColumns(#"Inserted Year1",{{"Year", "EndYear"}}),
#"Added Custom" = Table.AddColumn(#"Renamed Columns1", "Year", each List.Buffer({2010..2020})),
#"Expanded Custom" = Table.ExpandListColumn(#"Added Custom", "Year"),
#"Added Custom1" = Table.AddColumn(#"Expanded Custom", "tag", each if [Year] >= [StartYear] and[Year]<=[EndYear] then 1 else 0),
#"Filtered Rows" = Table.SelectRows(#"Added Custom1", each ([tag] = 1)),
#"Removed Columns1" = Table.RemoveColumns(#"Filtered Rows",{"StartYear", "EndYear"}),
#"Pivoted Column" = Table.Pivot(Table.TransformColumnTypes(#"Removed Columns1", {{"Year", type text}}, "en-US"), List.Distinct(Table.TransformColumnTypes(#"Removed Columns1", {{"Year", type text}}, "en-US")[Year]), "Year", "tag", List.Count),
#"Reordered Columns" = Table.ReorderColumns(#"Pivoted Column",{"EmpName", "StartDate", "DateEndate", "2015", "2016", "2017", "2018", "2019"})
in
#"Reordered Columns"
For example:
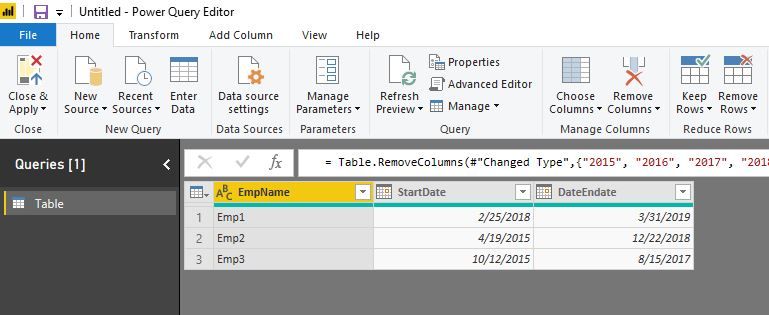
and here is pbix file, please try it.
Best Regards,
Lin
Hi,
You may download my PBI file from here.
Hope this helps.
Not able to download the file you shared. Can you pls check once.
Hi,
That link is working just fine.
hi, @slanka
You could try this way in Edit Queries:
let
Source = Table.FromRows(Json.Document(Binary.Decompress(Binary.FromText("i45Wcs0tMFTSUTLSNzLVNzIwtACyjfWNDUFsSyDbEAPH6oA1GQE5JvqGliCFpiAJoAlGMBNw6jIGcQz0DY1g2gws9A3BFptj1xYLAA==", BinaryEncoding.Base64), Compression.Deflate)), let _t = ((type text) meta [Serialized.Text = true]) in type table [EmpName = _t, StartDate = _t, DateEndate = _t, #"2015" = _t, #"2016" = _t, #"2017" = _t, #"2018" = _t, #"2019" = _t]),
#"Changed Type" = Table.TransformColumnTypes(Source,{{"EmpName", type text}, {"StartDate", type date}, {"DateEndate", type date}, {"2015", Int64.Type}, {"2016", Int64.Type}, {"2017", Int64.Type}, {"2018", Int64.Type}, {"2019", Int64.Type}}),
#"Removed Columns" = Table.RemoveColumns(#"Changed Type",{"2015", "2016", "2017", "2018", "2019"}),
#"Inserted Year" = Table.AddColumn(#"Removed Columns", "Year", each Date.Year([StartDate]), Int64.Type),
#"Renamed Columns" = Table.RenameColumns(#"Inserted Year",{{"Year", "StartYear"}}),
#"Inserted Year1" = Table.AddColumn(#"Renamed Columns", "Year", each Date.Year([DateEndate]), Int64.Type),
#"Renamed Columns1" = Table.RenameColumns(#"Inserted Year1",{{"Year", "EndYear"}}),
#"Added Custom" = Table.AddColumn(#"Renamed Columns1", "Year", each List.Buffer({2010..2020})),
#"Expanded Custom" = Table.ExpandListColumn(#"Added Custom", "Year"),
#"Added Custom1" = Table.AddColumn(#"Expanded Custom", "tag", each if [Year] >= [StartYear] and[Year]<=[EndYear] then 1 else 0),
#"Filtered Rows" = Table.SelectRows(#"Added Custom1", each ([tag] = 1)),
#"Removed Columns1" = Table.RemoveColumns(#"Filtered Rows",{"StartYear", "EndYear"}),
#"Pivoted Column" = Table.Pivot(Table.TransformColumnTypes(#"Removed Columns1", {{"Year", type text}}, "en-US"), List.Distinct(Table.TransformColumnTypes(#"Removed Columns1", {{"Year", type text}}, "en-US")[Year]), "Year", "tag", List.Count),
#"Reordered Columns" = Table.ReorderColumns(#"Pivoted Column",{"EmpName", "StartDate", "DateEndate", "2015", "2016", "2017", "2018", "2019"})
in
#"Reordered Columns"
For example:
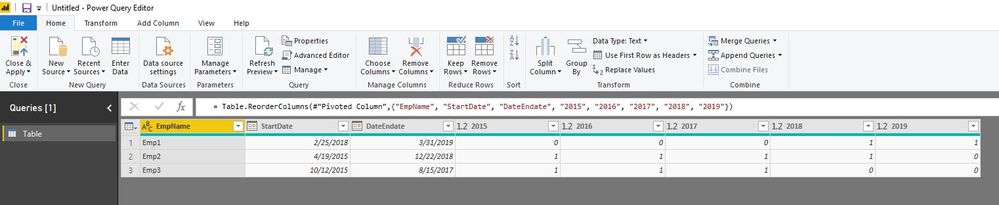
and here is pbix file, please try it.
Best Regards,
Lin
Join us in Barcelona for FabCon and SQLCon, the Fabric, Power BI, SQL, and AI community event. Save €200 with code FABCMTY200.
Join Data Days 2026: 60 days of free live/on-demand sessions, challenges, study groups, and certification opportunities.
| User | Count |
|---|---|
| 29 | |
| 23 | |
| 18 | |
| 18 | |
| 15 |
| User | Count |
|---|---|
| 51 | |
| 44 | |
| 43 | |
| 39 | |
| 33 |