Get certified for free when you join Fabric Data Days 2026 and dive into Fabric, Power BI, SQL, AI, and other essential data skills.
Join nowJuly 7 - July 17 | Round 2 of the Power BI Dataviz World Championships. Don't miss your chance! Learn more
Hi,
I want to try to create a filled map chart. I have my data : Country, Year, number of things.
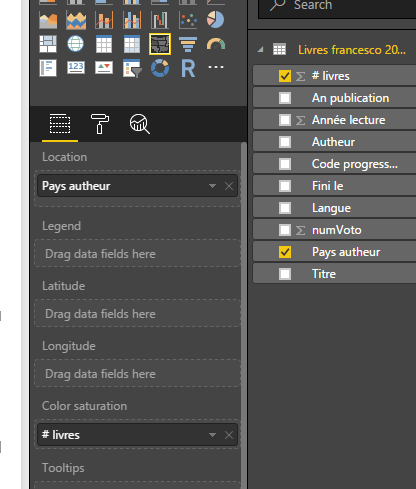
I click the map icon, I select the country field (if I drag the field into "Legend" I can see my countries), but the map, for this countries, don't change color.
I try with an Excel file of the book that I study (Pro Power BI Desktop) and all run correctly.
I don't understand.
Thanks for the help.
Solved! Go to Solution.
Hi Francesco,
please try to mark your country-column with the appropriate data category
You can find a Demo PBIX here.
Hope this helps 🙂
Frank
1. U have to drop the country in Legend and Location in both.
2. If your column name is not Country , then u have to set the column Data Category is "Country / Region "
This will help u sure . look the image .
If not helping u let me know i will help u sure 🙂
Thank you Frank and Baskar,
My problem was the data category!
I'm sorry, I have started to read my book only today, but I find PBI a fantastic tool. In the past I worked many years with Business Objects, but I think to find something easy and good for users like BO.
Thanks.
Hey mate,
I assume you're using the ArcGIS maps - did you
1) put the "number of things" column into the "Color" section of the map?
2) mark the country column with the data category Country/Region?
HTH,
Frank
Hi Frank,
Thanks for your help, I use the basic objects that I find in PBI Desktop. Look at the image.
Francesco
Hi Francesco,
please try to mark your country-column with the appropriate data category
You can find a Demo PBIX here.
Hope this helps 🙂
Frank
Join us in Barcelona for FabCon and SQLCon, the Fabric, Power BI, SQL, and AI community event. Save €200 with code FABCMTY200.
Join Fabric Data Days 2026: 60 days of free live/on-demand sessions, challenges, study groups, and certification opportunities.
| User | Count |
|---|---|
| 27 | |
| 23 | |
| 18 | |
| 15 | |
| 15 |
| User | Count |
|---|---|
| 65 | |
| 42 | |
| 41 | |
| 39 | |
| 37 |