This is best Fabric, Power BI, SQL and AI community event. How do we know? The last event sold out! Save €200 with code FABCMTY200.
Register nowThe Fabric community is upgrading! Read all of the details including the timeline and what you can expect. Learn more
Hi Guys,
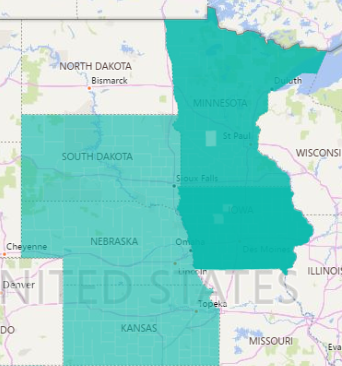
I'm trying to visualize data across various counties and I'm running into an issue where certain states are being filled in on top of their respective counties. The odd part is this is only happening in Iowa and Minnesota, while the other state's data is formatted in the exact same way ("County,ST") with no issues. The GIS map also works with no issues, but I'd like to see if I can get the native filled map working so I have the option of choosing between the two. Does anyone know what's going on here? I've included a screenshot below for reference. All help is appreciated, thanks to everyone in advance.
Hi. I was facing the same issue, except not in Iowa/Minnesotta but in Maryland. Try changing the data category of field you are using in the location well to 'Place' instead of 'County' in the 'Column Tools' tab. That did the trick for me. The counties are not overlapping anymore. I guess Power BI interprets 'Place' as more specific location than 'County'.
P.S. : I realize that the question is more than 2 years old. Still posting my response as it could be found useful by someone else who stumbles into the same issue. Cheers. 🙂
Bump
Hi @Anonymous
You may have a look at below posts to check if they could help you.
http://radacad.com/power-bi-filled-map-the-good-the-bad-and-the-ugly
Regards,
Cherie
Join us in Barcelona for FabCon and SQLCon, the Fabric, Power BI, SQL, and AI community event. Save €200 with code FABCMTY200.
| User | Count |
|---|---|
| 24 | |
| 22 | |
| 20 | |
| 18 | |
| 14 |
| User | Count |
|---|---|
| 45 | |
| 38 | |
| 24 | |
| 21 | |
| 20 |