Get certified for free when you join Fabric Data Days 2026 and dive into Fabric, Power BI, SQL, AI, and other essential data skills.
Join nowJuly 28 - August 9 | Final Round of the Power BI Dataviz World Championships. This is your chance. Learn more
I have a table with the bit columns shown in the socioeconomic slicer below - Minority Business, Small Business, etc. I've created Field Parameters to accomplish this (thanks @amitchandak)
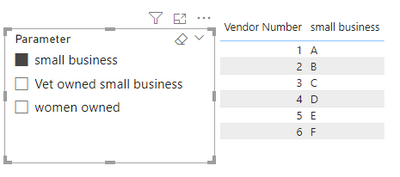
Vet Owned Small Business is selected below. The current behavior is that the table on the left will show each column selected on the right. Instead, I want to only show rows that are True for Vet Owned Small Business. I do not want Vet Owned Small Business to be displayed in the table on the left - only table should be filtered for True on the selected slicer items.
Solved! Go to Solution.
Hi @epelton ,
According to your description, here's my solution. Create a measure.
Measure =
VAR __SelectedValue =
SELECTCOLUMNS (
SUMMARIZE ( Parameter, Parameter[Parameter], Parameter[Parameter Fields] ),
"Parameter", Parameter[Parameter]
)
RETURN
IF (
COUNTROWS ( __SelectedValue ) > 1,
1,
IF (
__SelectedValue = "Vet owned small business"
&& MAX ( 'Table'[Vet owned small business] ) = "True"
|| __SelectedValue <> "Vet owned small business",
1,
0
)
)
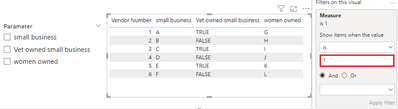
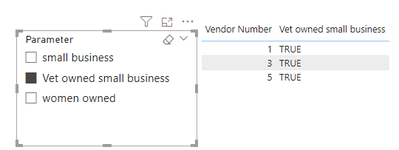
Put the measure in the visual filter and select "is 1". Get the correct result:
I attach my sample below for your reference.
Best regards,
Community Support Team_yanjiang
If this post helps, then please consider Accept it as the solution to help the other members find it more quickly.
Hi @epelton ,
According to your description, here's my solution. Create a measure.
Measure =
VAR __SelectedValue =
SELECTCOLUMNS (
SUMMARIZE ( Parameter, Parameter[Parameter], Parameter[Parameter Fields] ),
"Parameter", Parameter[Parameter]
)
RETURN
IF (
COUNTROWS ( __SelectedValue ) > 1,
1,
IF (
__SelectedValue = "Vet owned small business"
&& MAX ( 'Table'[Vet owned small business] ) = "True"
|| __SelectedValue <> "Vet owned small business",
1,
0
)
)
Put the measure in the visual filter and select "is 1". Get the correct result:
I attach my sample below for your reference.
Best regards,
Community Support Team_yanjiang
If this post helps, then please consider Accept it as the solution to help the other members find it more quickly.
If you love stickers, then you will definitely want to check out our community sticker challenge, Barcelona edition!
Check out the July 2026 Power BI update to learn about new features.
| User | Count |
|---|---|
| 29 | |
| 28 | |
| 20 | |
| 20 | |
| 19 |
| User | Count |
|---|---|
| 35 | |
| 26 | |
| 20 | |
| 18 | |
| 17 |