Join us at FabCon Vienna from September 15-18, 2025
The ultimate Fabric, Power BI, SQL, and AI community-led learning event. Save €200 with code FABCOMM.
Get registered- Power BI forums
- Get Help with Power BI
- Desktop
- Service
- Report Server
- Power Query
- Mobile Apps
- Developer
- DAX Commands and Tips
- Custom Visuals Development Discussion
- Health and Life Sciences
- Power BI Spanish forums
- Translated Spanish Desktop
- Training and Consulting
- Instructor Led Training
- Dashboard in a Day for Women, by Women
- Galleries
- Data Stories Gallery
- Themes Gallery
- Contests Gallery
- Quick Measures Gallery
- Notebook Gallery
- Translytical Task Flow Gallery
- TMDL Gallery
- R Script Showcase
- Webinars and Video Gallery
- Ideas
- Custom Visuals Ideas (read-only)
- Issues
- Issues
- Events
- Upcoming Events
Compete to become Power BI Data Viz World Champion! First round ends August 18th. Get started.
- Power BI forums
- Forums
- Get Help with Power BI
- Desktop
- Dynamic slicer columns
- Subscribe to RSS Feed
- Mark Topic as New
- Mark Topic as Read
- Float this Topic for Current User
- Bookmark
- Subscribe
- Printer Friendly Page
- Mark as New
- Bookmark
- Subscribe
- Mute
- Subscribe to RSS Feed
- Permalink
- Report Inappropriate Content
Dynamic slicer columns
Hi,
I have a table
I want calculate 3 new columns.
Max = Story point * Low confidence multiplier
Min = Story point * high confidence multiplier
Medium = if (confidence = High then Story Point * High confidence multiplier
Elseif confidence = Medium then Story point * medium confidence multiplier
Else Story point * medium confidence multiplier
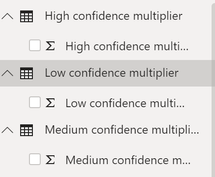
I then want to dynamicaly update through slicer the confidence multiplier for each level of confidence, hence I created three disconnected parameter tables
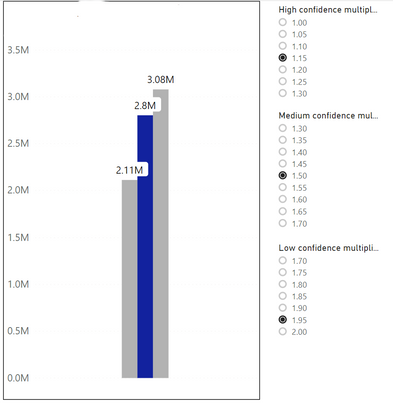
The result should look more or less like this, where with each change to confidence I would see update on the chart
When I tried to measure with following formula, I get blank results.
MD Minimum M = SUMX('Work Items - Today',
                'Work Items - Today'[SP MD] * SELECTEDVALUE('High confidence multiplier'[High confidence multiplier]))
I also tried a column
MD Minimum = 'Work Items - Today'[SP MD] * SELECTEDVALUE('High confidence multiplier'[High confidence multiplier])
but also blank result
What am I doing wrong?
Thanks for help
Best
Marcin
Solved! Go to Solution.
- Mark as New
- Bookmark
- Subscribe
- Mute
- Subscribe to RSS Feed
- Permalink
- Report Inappropriate Content
Hi @Anonymous ,
I am not sure your problem, you could refer to my sample for details. If this is not waht you want, please correct me and inform me more detailed information.
Best Regards,
Zoe Zhi
If this post helps, then please consider Accept it as the solution to help the other members find it more quickly.
- Mark as New
- Bookmark
- Subscribe
- Mute
- Subscribe to RSS Feed
- Permalink
- Report Inappropriate Content
Can you post that sample data as text? Also, note that you cannot have a column update dynamically based on a slicer. Once you introduce interactivity into the equation, you need to use measures.
Follow on LinkedIn
@ me in replies or I'll lose your thread!!!
Instead of a Kudo, please vote for this idea
Become an expert!: Enterprise DNA
External Tools: MSHGQM
YouTube Channel!: Microsoft Hates Greg
Latest book!: DAX For Humans
DAX is easy, CALCULATE makes DAX hard...
- Mark as New
- Bookmark
- Subscribe
- Mute
- Subscribe to RSS Feed
- Permalink
- Report Inappropriate Content
Here you are. I tried both, none work, but good to know, columns won't work, already an important hint 🙂
| Work Item Id | Confidence | SP MD |
| 10 | High | 5 |
| 11 | High | 3 |
| 12 | Low | 110 |
| 13 | High | 3 |
| 14 | Medium | 5 |
| 15 | High | 3 |
| 16 | Low | 10 |
| 17 | Low | 5 |
| 18 | Medium | 5 |
| 19 | Medium | 5 |
| 20 | Low | 5 |
| 21 | High | 10 |
| 22 | Medium | 10 |
| 23 | High | 3 |
| 24 | Medium | 5 |
| 25 | Medium | 10 |
| 27 | Medium | 10 |
| 28 | High | 3 |
| 29 | Medium | 10 |
| 30 | High | 3 |
| 31 | High | 3 |
| 32 | Low | 10 |
| 34 | Medium | 10 |
| 35 | Medium | 5 |
- Mark as New
- Bookmark
- Subscribe
- Mute
- Subscribe to RSS Feed
- Permalink
- Report Inappropriate Content
Hi @Anonymous ,
I am not sure your problem, you could refer to my sample for details. If this is not waht you want, please correct me and inform me more detailed information.
Best Regards,
Zoe Zhi
If this post helps, then please consider Accept it as the solution to help the other members find it more quickly.


