cancel
Showing results for 
Search instead for 
Did you mean: 

The Fabric community is upgrading! Read all of the details including the timeline and what you can expect. Learn more

Reply
anandgovindaraj
Frequent Visitor

Dynamic date time range for line plot

I have a hourly price data, below is a sample:


Eventdatetime   Price

7/1/2019 0:00    22
7/1/2019 1:00    24
7/1/2019 2:00    24
7/1/2019 3:00    23
7/1/2019 4:00    23
7/1/2019 5:00    25
7/1/2019 6:00    28


I created a simple line plot of price time series and I have a slicer  (between dates) to control the number of days to be  viewed. 


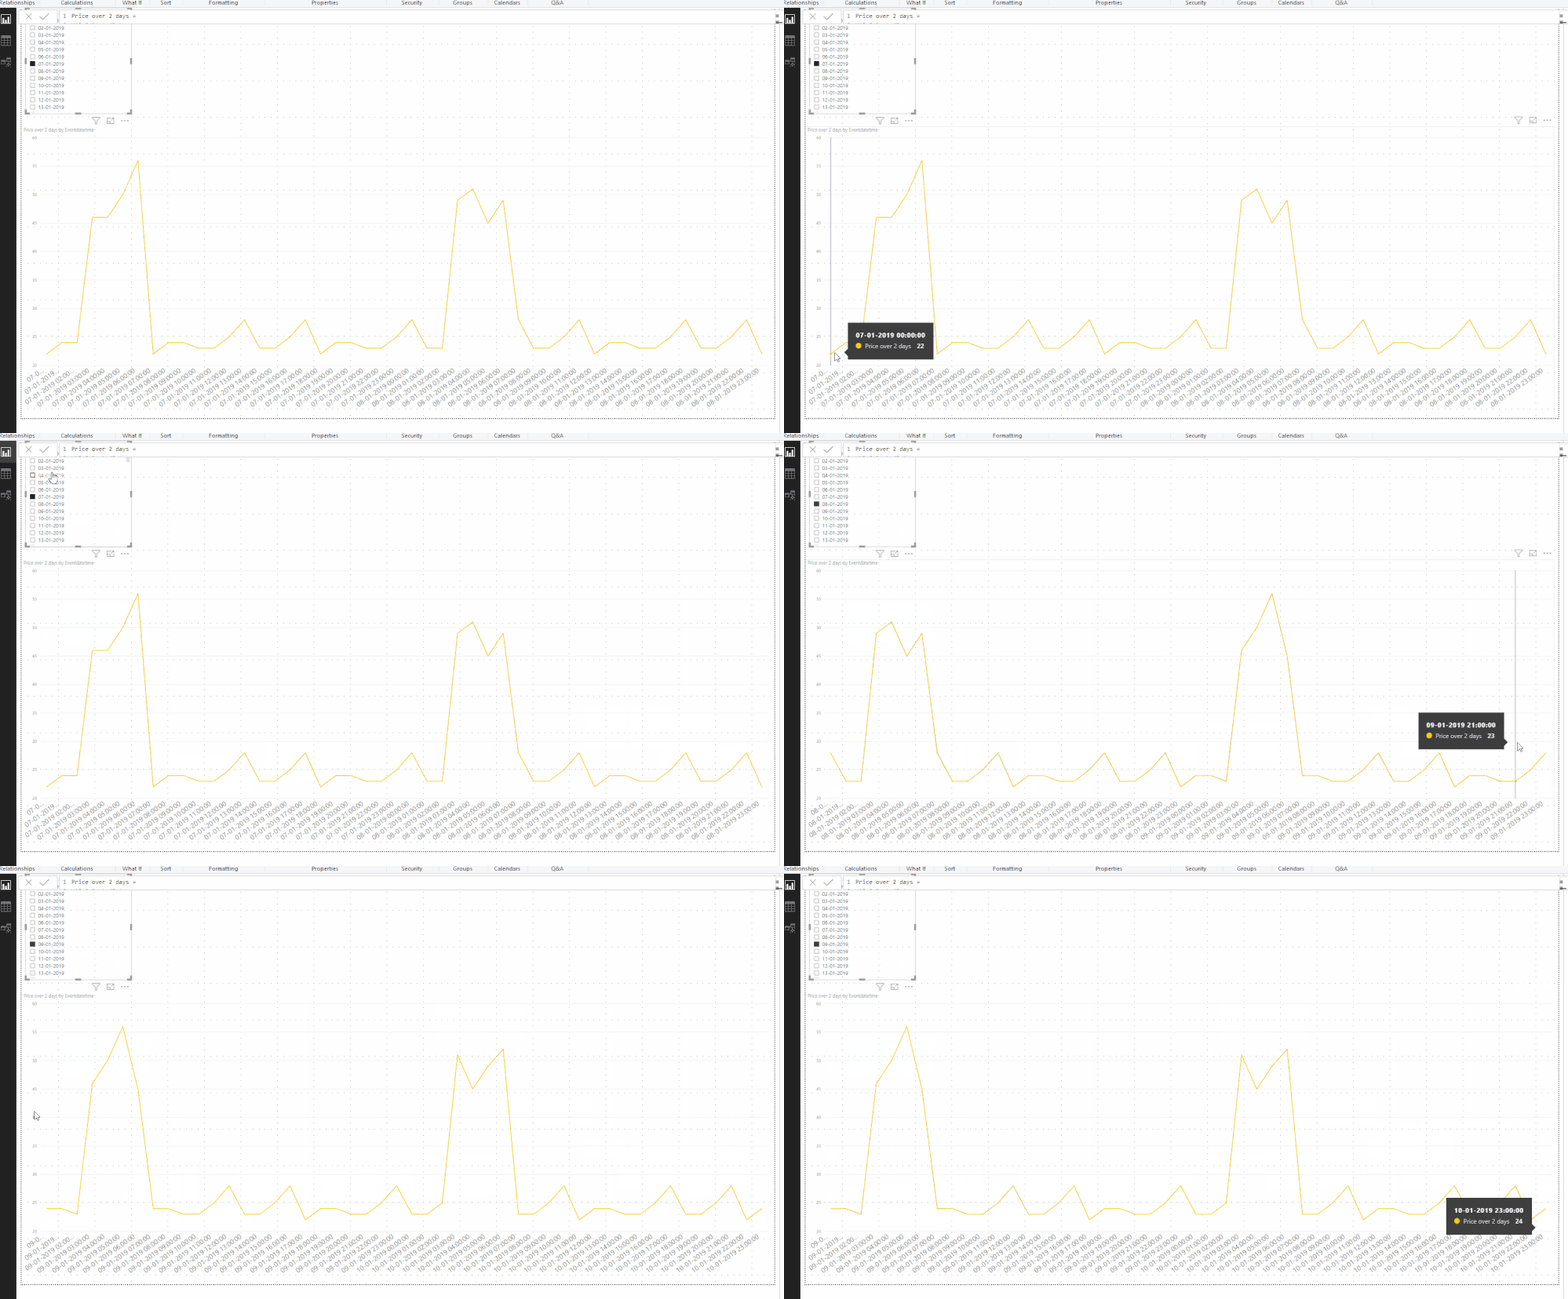
Is it possible to plot, two days ( 48 hours) at a time ? Yes, I can use the slicer for this but the goal is to allow the user to select a day ( using a slicer with list of all dates)  and the plot should show hourly prices for selected day and the next day. 


Thanks!

2 ACCEPTED SOLUTIONS
MFelix
Super User
Super User

Hi @anandgovindaraj ,


You need to do the following steps:

  • Create a calendar table to use as filter (this table must not be related with the dataset)
  • Add the following measure:
Price over 2 days = 
VAR SelectedDate =
    MAX ( DimDate[Date] )
VAR Number_of_days = 1 //Used to create number of days to show in chart if want to show 3 days number should be 2
RETURN   
CALCULATE (
        SUM ( EventDate[Price] );
        FILTER (
            ALL ( EventDate[Eventdatetime].[Date] );
            EventDate[Eventdatetime].[Date] >= SelectedDate
                && EventDate[Eventdatetime].[Date] <= SelectedDate + Number_of_days
        )
    )


  • Create a slicer with the calendar table
  • And a chart with the EventDatetime and the previous measure.

Final result below:

2 days.gif


See attach PBIX file.


Regards,

MFelix


Regards

Miguel Félix


Did I answer your question? Mark my post as a solution!

Proud to be a Super User!

Check out my blog: Power BI em Português


View solution in original post

@anandgovindaraj solution attached, just add a simple measure as below, and create a date table for slicer.


Total Price = 
CALCULATE( SUM( Table1[ Price] ),  
DATESBETWEEN( Table1[Eventdatetime ].[Date], 
MIN( 'Calendar'[Date] ), 
NEXTDAY( 'Calendar'[Date] ) ))


Subscribe to the @PowerBIHowTo YT channel for an upcoming video on List and Record functions in Power Query!!

Learn Power BI and Fabric - subscribe to our YT channel - Click here: @PowerBIHowTo

If my solution proved useful, I'd be delighted to receive Kudos. When you put effort into asking a question, it's equally thoughtful to acknowledge and give Kudos to the individual who helped you solve the problem. It's a small gesture that shows appreciation and encouragement! ❤


Did I answer your question? Mark my post as a solution. Proud to be a Super User! Appreciate your Kudos 🙂
Feel free to email me with any of your BI needs.

View solution in original post

3 REPLIES 3
anandgovindaraj
Frequent Visitor

Thanks!

MFelix
Super User
Super User

Hi @anandgovindaraj ,


You need to do the following steps:

  • Create a calendar table to use as filter (this table must not be related with the dataset)
  • Add the following measure:
Price over 2 days = 
VAR SelectedDate =
    MAX ( DimDate[Date] )
VAR Number_of_days = 1 //Used to create number of days to show in chart if want to show 3 days number should be 2
RETURN   
CALCULATE (
        SUM ( EventDate[Price] );
        FILTER (
            ALL ( EventDate[Eventdatetime].[Date] );
            EventDate[Eventdatetime].[Date] >= SelectedDate
                && EventDate[Eventdatetime].[Date] <= SelectedDate + Number_of_days
        )
    )


  • Create a slicer with the calendar table
  • And a chart with the EventDatetime and the previous measure.

Final result below:

2 days.gif


See attach PBIX file.


Regards,

MFelix


Regards

Miguel Félix


Did I answer your question? Mark my post as a solution!

Proud to be a Super User!

Check out my blog: Power BI em Português


@anandgovindaraj solution attached, just add a simple measure as below, and create a date table for slicer.


Total Price = 
CALCULATE( SUM( Table1[ Price] ),  
DATESBETWEEN( Table1[Eventdatetime ].[Date], 
MIN( 'Calendar'[Date] ), 
NEXTDAY( 'Calendar'[Date] ) ))


Subscribe to the @PowerBIHowTo YT channel for an upcoming video on List and Record functions in Power Query!!

Learn Power BI and Fabric - subscribe to our YT channel - Click here: @PowerBIHowTo

If my solution proved useful, I'd be delighted to receive Kudos. When you put effort into asking a question, it's equally thoughtful to acknowledge and give Kudos to the individual who helped you solve the problem. It's a small gesture that shows appreciation and encouragement! ❤


Did I answer your question? Mark my post as a solution. Proud to be a Super User! Appreciate your Kudos 🙂
Feel free to email me with any of your BI needs.

Helpful resources

Announcements
FabCon and SQLCon Barcelona 2026

FabCon & SQLCon – Barcelona 2026

Join us in Barcelona for FabCon and SQLCon, the Fabric, Power BI, SQL, and AI community event. Save €200 with code FABCMTY200.

Power BI DataViz World Championships carousel

Power BI DataViz World Championships - June 2026

A new Power BI DataViz World Championship is coming this June! Don't miss out on submitting your entry.