This is best Fabric, Power BI, SQL and AI community event. How do we know? The last event sold out! Save €200 with code FABCMTY200.
Register nowA new Data Days event is coming soon! This time we’re going bigger than ever. Fabric, Power BI, SQL, AI and more. Don't miss out.
Solved! Go to Solution.
Hi @karma ,
Yes, it can be achieved using conditional formatting of the visual.
Please try the below steps:
1) Click on your card visual and go to your format options
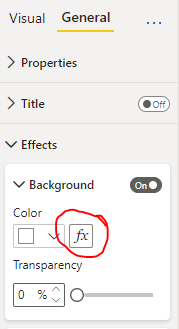
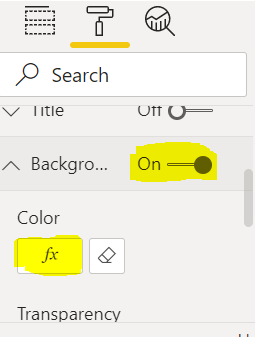
2) In format, click on background colour
turn the toggle on and click on fx (refer screenshot below)
3)After clicking on fx, a window would pop up:
in format style- Select Rule
what field should we base it on? - Select your measure/calculation
In rules give your conditions:
eg- if value > 10 then select your desired colour(Refer screenshot below):
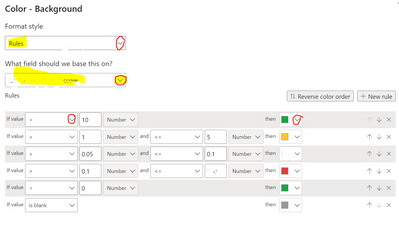
Then click on OK.
@karma if this helps you then please mark it as a solution & hit the thumbs up. Thank you.
Hi @karma ,
Yes, it can be achieved using conditional formatting of the visual.
Please try the below steps:
1) Click on your card visual and go to your format options
2) In format, click on background colour
turn the toggle on and click on fx (refer screenshot below)
3)After clicking on fx, a window would pop up:
in format style- Select Rule
what field should we base it on? - Select your measure/calculation
In rules give your conditions:
eg- if value > 10 then select your desired colour(Refer screenshot below):
Then click on OK.
@karma if this helps you then please mark it as a solution & hit the thumbs up. Thank you.
Check out the May 2026 Power BI update to learn about new features.
Sign up to receive a private message when registration opens and key events begin.
If you have recently started exploring Fabric, we'd love to hear how it's going. Your feedback can help with product improvements.
| User | Count |
|---|---|
| 29 | |
| 25 | |
| 25 | |
| 21 | |
| 14 |
| User | Count |
|---|---|
| 59 | |
| 50 | |
| 25 | |
| 20 | |
| 20 |