Forum Discussion

Display values in 10 mins interval
11 Replies
- AnonymousNot applicable
Hi Anonymous,
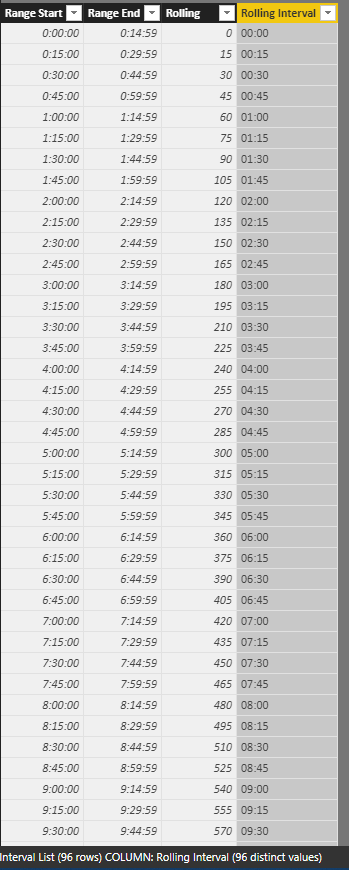
I'd like to suggest you add a calculate column to convert time value as specific range. Then you can create a time interval table and build relationship between above column and time interval table column.
Table sample:
Time interval =
SELECTCOLUMNS (
    GENERATESERIES ( TIME ( 0, 0, 0 ), TIME ( 23, 59, 59 ), TIME ( 0, 15, 0 ) ),
    "Start", [Value],
    "End", [Value] + TIME ( 0, 14, 59 ),
    "Index", (
        HOUR ( [Value] ) * 60
            + MINUTE ( [Value] )
    )
        / 15,
    "Rolling interval", [Value]
)
After these steps, you can use time interval column(rolling interval) and original table amount to create visual graph.
Regards,
Xiaoxin Sheng
- AnonymousNot applicable
Hello Anonymous Sorry for replying late it was a Christmas break
I didn't understand your solution and it is not me who accepted it as a solution :)
How can I create a calculated column to convert time value as a specific range? I have created a calculated column, time interval(time2) and made a relationship between rolling interval and time2 column, but it didn't solve my problem(it still shows me 6 body values in 10 mins) and when I try to use rolling interval on a shared axis the other columns from the original table doesn't display value on the visualization(For example, Airflow and body value)
Below is the time interval column I createdtime2 = DATE(YEAR(CombinedTable[Date]),MONTH(CombinedTable[Date]),DAY(CombinedTable[Date]))+TIME(HOUR(CombinedTable[Date]),FLOOR(MINUTE(CombinedTable[Date]),10),0)
- AnonymousNot applicable
HI Anonymous,
Can you please share a sample pbix file with some sample data for test?
Regards,Xiaoxin Sheng
- themistoklisCommunity Champion