Get certified for free when you join Fabric Data Days 2026 and dive into Fabric, Power BI, SQL, AI, and other essential data skills.
Join nowJuly 7 - July 17 | Round 2 of the Power BI Dataviz World Championships. Don't miss your chance! Learn more
Good Morning,
So once again after some help!
I have the attached which is an example as orginal has 2 years of data and many more rows and columns (about 10k rows per year for claims and 150k per year for notes) that i need to try to work out how to do the following..
" I need to see for each day of the year how many files each handler had open and the % of these where the last note was more than 3 days ago"
So i have 1 table which contains all file references with the date opend and date closed with handler name (as part of a bigger table),
I then have a notes table with Date of note and reference (as part of a bigger table)
So im thinking i need to somehow create a date table which summarises by handler how many open files they had and of them open files how many werent contacted "in the notes table" in the last 3 days and then divide one against the other.
EDIT: DropBox File
Solved! Go to Solution.
Hi @sovereignauto ,
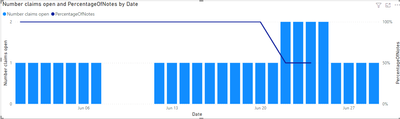
Create a calendar table then add the following measure to your model:
Number claims open =
COUNTROWS (
FILTER (
Claims,
Claims[Date Opend] <= MAX ( 'Calendar'[Date] )
&& Claims[Date Closed ] >= MAX ( 'Calendar'[Date] )
)
)PercentageOfNotes =
VAR tempTable =
SELECTCOLUMNS (
FILTER (
Claims,
Claims[Date Opend] <= MAX ( 'Calendar'[Date] )
&& Claims[Date Closed ] >= MAX ( 'Calendar'[Date] )
),
"Claim", Claims[Ref]
)
VAR Notes_Values =
SUMMARIZE (
FILTER (
'Notes',
Notes[Date] <= MAX ( 'Calendar'[Date] )
&& Notes[Date]
>= MAX ( 'Calendar'[Date] ) - 2
&& Notes[Ref] IN tempTable
),
Notes[Ref]
)
RETURN
DIVIDE ( COUNTROWS ( Notes_Values ), [Number claims open] )
See result below and in attach PBIX file.
Regards
Miguel Félix
Proud to be a Super User!
Check out my blog: Power BI em PortuguêsHi @sovereignauto ,
Create a calendar table then add the following measure to your model:
Number claims open =
COUNTROWS (
FILTER (
Claims,
Claims[Date Opend] <= MAX ( 'Calendar'[Date] )
&& Claims[Date Closed ] >= MAX ( 'Calendar'[Date] )
)
)PercentageOfNotes =
VAR tempTable =
SELECTCOLUMNS (
FILTER (
Claims,
Claims[Date Opend] <= MAX ( 'Calendar'[Date] )
&& Claims[Date Closed ] >= MAX ( 'Calendar'[Date] )
),
"Claim", Claims[Ref]
)
VAR Notes_Values =
SUMMARIZE (
FILTER (
'Notes',
Notes[Date] <= MAX ( 'Calendar'[Date] )
&& Notes[Date]
>= MAX ( 'Calendar'[Date] ) - 2
&& Notes[Ref] IN tempTable
),
Notes[Ref]
)
RETURN
DIVIDE ( COUNTROWS ( Notes_Values ), [Number claims open] )
See result below and in attach PBIX file.
Regards
Miguel Félix
Proud to be a Super User!
Check out my blog: Power BI em Português@MFelix thank you so much it is a great start!
Do you know how i would be able to "group by" Handler as well as date? so for each date how many files each handler had?
Hi @sovereignauto ,
Not sure if I understand what you want to but in the example I send out you just need to add the Handler to the Column series:
In the way the measures are calculated you can use any column on your tables to give further detail.
Regards
Miguel Félix
Proud to be a Super User!
Check out my blog: Power BI em PortuguêsJoin us in Barcelona for FabCon and SQLCon, the Fabric, Power BI, SQL, and AI community event. Save €200 with code FABCMTY200.
Join Data Days 2026: 60 days of free live/on-demand sessions, challenges, study groups, and certification opportunities.
| User | Count |
|---|---|
| 28 | |
| 23 | |
| 18 | |
| 18 | |
| 15 |
| User | Count |
|---|---|
| 47 | |
| 44 | |
| 43 | |
| 35 | |
| 32 |