
This is best Fabric, Power BI, SQL and AI community event. How do we know? The last event sold out! Save €200 with code FABCMTY200.
Register nowThe Fabric community is upgrading! Read all of the details including the timeline and what you can expect. Learn more
Dear Team,
Kindly look into the attached file. could you please help me arrange data as shown below. we can do it simply with the excel, but don't know how to do it with the Power BI.
Thank you very much for your time.
Table which i need
Solved! Go to Solution.
Hi @Anonymous,
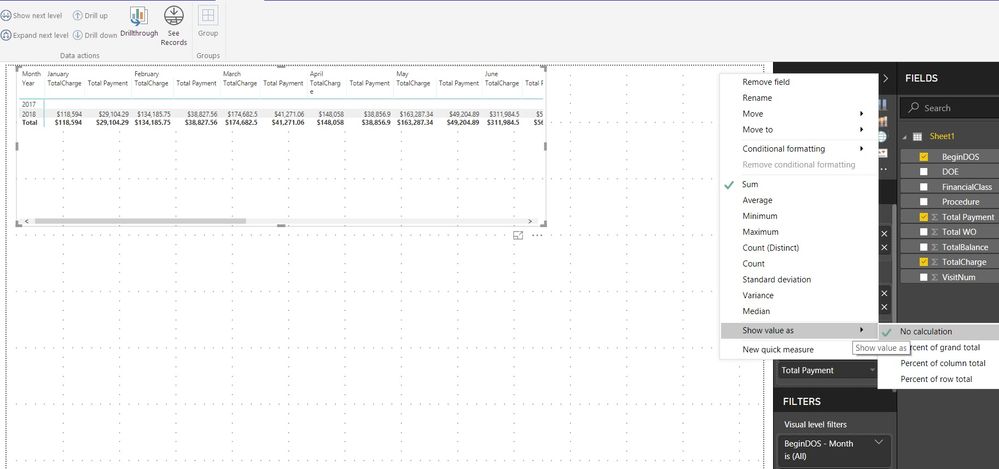
Sorry i couldn't find that option. Could you please give me more details.
thank you.
I'd try the Matrix visual, and on the settings for the visual under "Values" turn on "Show on Rows"
Hi @Anonymous,
Sorry i couldn't find that option. Could you please give me more details.
thank you.
Sorry got it ![]()
thanks lot.
Join us in Barcelona for FabCon and SQLCon, the Fabric, Power BI, SQL, and AI community event. Save €200 with code FABCMTY200.
| User | Count |
|---|---|
| 24 | |
| 22 | |
| 20 | |
| 18 | |
| 14 |
| User | Count |
|---|---|
| 29 | |
| 22 | |
| 22 | |
| 20 | |
| 20 |