Get certified for free when you join Fabric Data Days 2026 and dive into Fabric, Power BI, SQL, AI, and other essential data skills.
Join nowJuly 28 - August 9 | Final Round of the Power BI Dataviz World Championships. This is your chance. Learn more
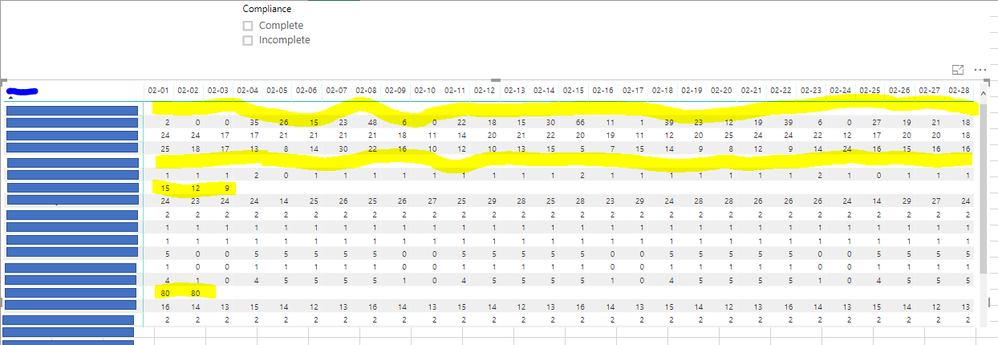
Okay first, here the unfiltered table, notice that there are entries with complete data Feb 01 through 28) and there are those with completely blank or partially blank.
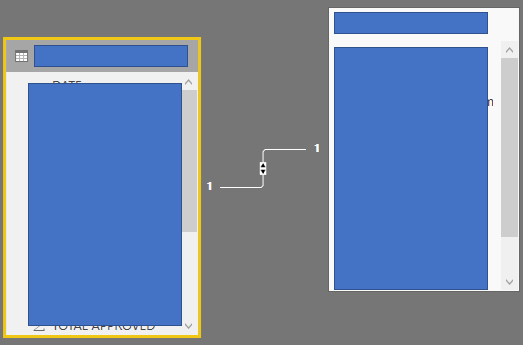
Here's how the Relationships look like (absically just 1 is to 1, basic 1 table is dimension and the other is data,.
\
Basically I need to create a filter that will show all complete/incomplete entries and here's what I did:
Category= SWITCH(
TRUE(),
CALCULATE(COUNTROWS(DimTable),ISBLANK('DataTable'[TotalColumn]))>0,"Incomplete",
CALCULATE(COUNTROWS(DimTable),ISBLANK('DataTable'[TotalColumn]))=0,"Complete")
The "Complete" filter seem to work accordingly but when I do the "Incomplete" filter, those days with some data were lost: This is what it looks like:
(sorry i can't seem to paste more image but i think you get it... I am, expecting all entries with no data at all to appear and those entries with incomplete data submitted, unfortunately not working for now.
Solved! Go to Solution.
You may take a look at the following post.
https://community.powerbi.com/t5/Desktop/Tricky-Slicer-Options/m-p/573381#M270846
You may take a look at the following post.
https://community.powerbi.com/t5/Desktop/Tricky-Slicer-Options/m-p/573381#M270846
If you love stickers, then you will definitely want to check out our community sticker challenge, Barcelona edition!
Check out the July 2026 Power BI update to learn about new features.
| User | Count |
|---|---|
| 30 | |
| 28 | |
| 23 | |
| 21 | |
| 19 |
| User | Count |
|---|---|
| 40 | |
| 31 | |
| 18 | |
| 18 | |
| 15 |