Get certified for free when you join Fabric Data Days 2026 and dive into Fabric, Power BI, SQL, AI, and other essential data skills.
Join nowJuly 28 - August 9 | Final Round of the Power BI Dataviz World Championships. This is your chance. Learn more
Hi,
I am using Cricket related data for one of my report. I would like to find out Maximum Strike Rate batsmans with more than 100 runs. I am using below formula
Best Strike Rate =
var temp = FILTER(
SUMMARIZE(deliveries,
deliveries[match_id],
deliveries[Batsman],
"StrikeRate", 100* SUM(deliveries[batsman_runs])/COUNT(deliveries[Batsman])
),SUM(deliveries[batsman_runs]) >= 100)
return
MAXX(temp, [StrikeRate])
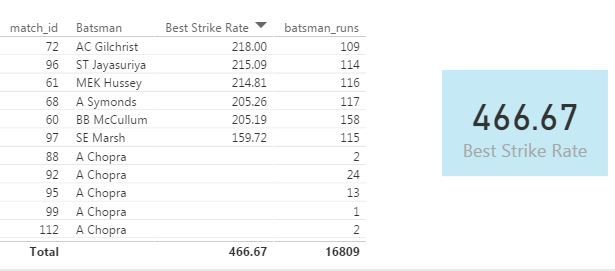
It's showing total strike rate & not the max stike rate. Kindly advise. Attached screenshot for your reference.
Solved! Go to Solution.
Hi @ajinkya1907
How about this one?
Best Strike Rate =
VAR temp =
FILTER (
SUMMARIZE (
deliveries,
deliveries[match_id],
deliveries[Batsman],
"StrikeRate", 100 * SUM ( deliveries[batsman_runs] )
/ COUNT ( deliveries[Batsman] )
),
CALCULATE ( SUM ( deliveries[batsman_runs] ) ) >= 100
)
RETURN
MAXX ( temp, [StrikeRate] )
Hi @ajinkya1907
How about this one?
Best Strike Rate =
VAR temp =
FILTER (
SUMMARIZE (
deliveries,
deliveries[match_id],
deliveries[Batsman],
"StrikeRate", 100 * SUM ( deliveries[batsman_runs] )
/ COUNT ( deliveries[Batsman] )
),
CALCULATE ( SUM ( deliveries[batsman_runs] ) ) >= 100
)
RETURN
MAXX ( temp, [StrikeRate] )
Well That works just fine. @Zubair_Muhammad, I am your fan buddy.
Could you please explain why calculate function made the difference? I am not able to understand that part.
Hi @ajinkya1907
Wow I have 2 fans now... Other is my 3 year old son
Actually FILTER function is an ITERATOR.... it creates a ROW context and not a FILTER context
thats why you have to use Calculate
Join us in Barcelona for FabCon and SQLCon, the Fabric, Power BI, SQL, and AI community event. Save €200 with code FABCMTY200.
If you love stickers, then you will definitely want to check out our community sticker challenge, Barcelona edition!
Check out the July 2026 Power BI update to learn about new features.
| User | Count |
|---|---|
| 31 | |
| 28 | |
| 24 | |
| 24 | |
| 19 |
| User | Count |
|---|---|
| 44 | |
| 31 | |
| 17 | |
| 17 | |
| 15 |