Get certified for free when you join Fabric Data Days 2026 and dive into Fabric, Power BI, SQL, AI, and other essential data skills.
Join nowJuly 7 - July 17 | Round 2 of the Power BI Dataviz World Championships. Don't miss your chance! Learn more
Hello All
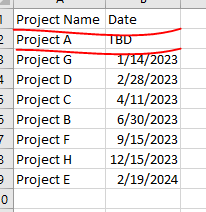
How to get this custom sort applied in tale matrix on Date column when date vaue is TBD, display project at the end of rows or as last project . Project,Date column is dynamic feed from oracle source.
Thanks
Rp
Solved! Go to Solution.
Hi @RMRaptor,
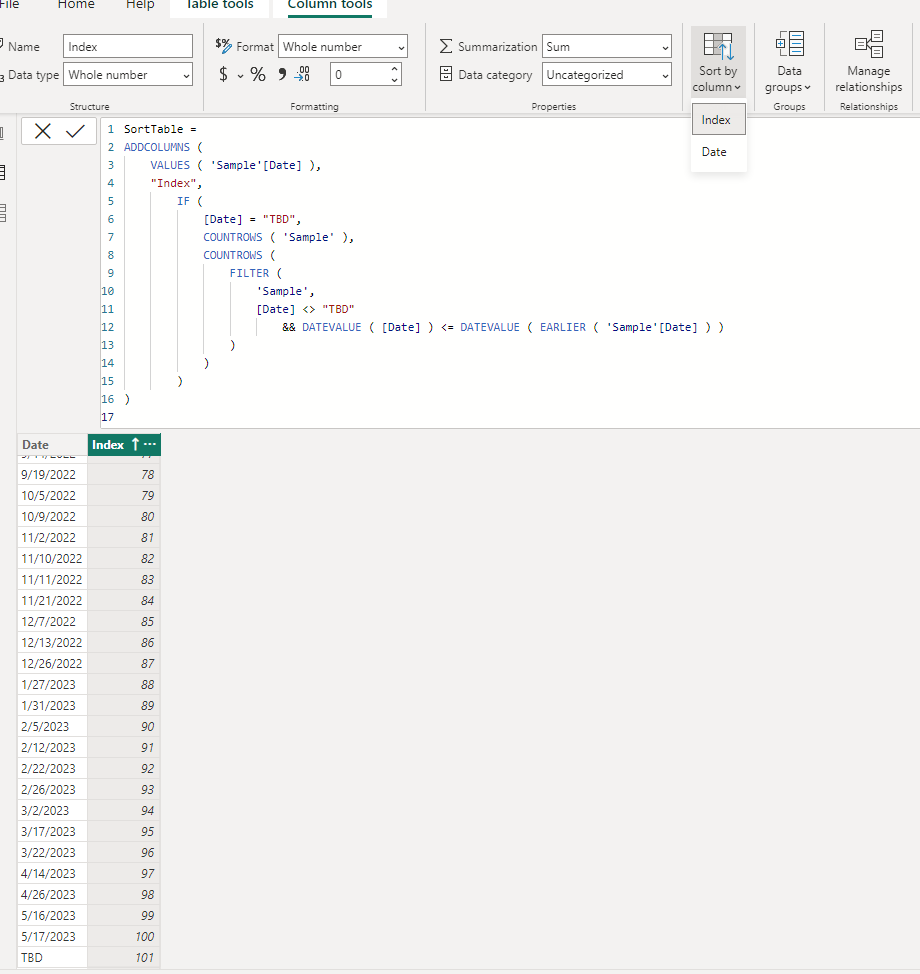
You can create a new table with corresponding date field values in text format and custom column with index based on date values to use on 'sort by column' property. (use if statement to check if current value equal to TBD and return a larger number to keep its order to bottom)
SortTable =
ADDCOLUMNS (
VALUES ( 'Sample'[Date] ),
"Index",
IF (
[Date] = "TBD",
COUNTROWS ( 'Sample' ),
COUNTROWS (
FILTER (
'Sample',
[Date] <> "TBD"
&& DATEVALUE ( [Date] ) <= DATEVALUE ( EARLIER ( 'Sample'[Date] ) )
)
)
)
)
Regards,
Xiaoxin Sheng
@Xiaoxin Sheng
Thank you , It worked.
RM
Hi @RMRaptor,
You can create a new table with corresponding date field values in text format and custom column with index based on date values to use on 'sort by column' property. (use if statement to check if current value equal to TBD and return a larger number to keep its order to bottom)
SortTable =
ADDCOLUMNS (
VALUES ( 'Sample'[Date] ),
"Index",
IF (
[Date] = "TBD",
COUNTROWS ( 'Sample' ),
COUNTROWS (
FILTER (
'Sample',
[Date] <> "TBD"
&& DATEVALUE ( [Date] ) <= DATEVALUE ( EARLIER ( 'Sample'[Date] ) )
)
)
)
)
Regards,
Xiaoxin Sheng
Join us in Barcelona for FabCon and SQLCon, the Fabric, Power BI, SQL, and AI community event. Save €200 with code FABCMTY200.
Join Data Days 2026: 60 days of free live/on-demand sessions, challenges, study groups, and certification opportunities.
| User | Count |
|---|---|
| 26 | |
| 23 | |
| 19 | |
| 18 | |
| 15 |
| User | Count |
|---|---|
| 47 | |
| 44 | |
| 43 | |
| 35 | |
| 31 |