This is best Fabric, Power BI, SQL and AI community event. How do we know? The last event sold out! Save €200 with code FABCMTY200.
Register nowA new Data Days event is coming soon! This time we’re going bigger than ever. Fabric, Power BI, SQL, AI and more. Don't miss out.
Hello all,
I am trying to create a table visual in which the user can choose which columns they view via a slicer. I have a spreadsheet with 26 columns, and they thematically can be grouped together into 9 groups. So ideally the user could choose 'group 1' from the slicer and all group 1 columns will populate the table.
For example, say we have the following table:
UID | Name | DOB | Shoe Size | Height | Favourite Colour | Favourite Animal | Favourite Shape | Favourite Food |
1 | Bob | 20/06/1963 | 8 | 175 | Blue | Dog | Circle | Pizza |
2 | Sarah | 21/06/1963 | 9 | 173 | Yellow | Dog | Circle | Lasagne |
3 | Sally | 22/06/1963 | 10 | 178 | Blue | Cat | Circle | Pizza |
4 | Fred | 23/06/1963 | 11 | 191 | Red | Cat | Circle | Burger |
5 | Harold | 24/06/1963 | 12 | 123 | Blue | Hamster | Square | Sausage |
I would like to have two permanent columns (group zero) that contain UID and Name. I would then like to designate DOB, Shoe Size, and Height as ‘Basic Information’ (group 1) and the Favourite columns as ‘Favourite things’ (group 2). I would then like to be able to choose which group of columns to view via a slicer.
I have had a deep dive into this and have not been able to find anything that quite matches what I am after. I am happy to be pointed in the direction of any solved solutions or training that is relevant. Any and all help would be greatly appreciated.
Thanks in advanced!
Solved! Go to Solution.
Hi @sam_sirius ,
You can follow the steps below to achieve it:
1. Add one index column and unpivot the columns except the new index column in Power Query Editor
let
Source = Table.FromRows(Json.Document(Binary.Decompress(Binary.FromText("bc/BDoIwDAbgd9mZBDYQ4QrGcPBg9GQIh6oLkkwXB4uRp7fthUU9rFvT7Ev/thVSRKKyZ6wqiZM8lmWeYlPgkesVDY3XeG1sj7Ue3MVQux/mGUQXtUJhdwQHNyJkQJRM0OukjbGvX2QHI/QPzUzKjDFvYlTAyISdYlmlhun/Khl2W6evRKQhQSFlSfXA0y+h8q7XjglK3ICzhpEsRBSXdNmjgfs44T9c/OnBaU7gMRIm6j4=", BinaryEncoding.Base64), Compression.Deflate)), let _t = ((type nullable text) meta [Serialized.Text = true]) in type table [UID = _t, Name = _t, DOB = _t, #"Shoe Size" = _t, Height = _t, #"Favourite Colour" = _t, #"Favourite Animal" = _t, #"Favourite Shape" = _t, #"Favourite Food " = _t]),
#"Changed Type" = Table.TransformColumnTypes(Source,{{"UID", Int64.Type}, {"Name", type text}, {"DOB", type text}, {"Shoe Size", Int64.Type}, {"Height", Int64.Type}, {"Favourite Colour", type text}, {"Favourite Animal", type text}, {"Favourite Shape", type text}, {"Favourite Food ", type text}}),
#"Added Index" = Table.AddIndexColumn(#"Changed Type", "Index", 1, 1, Int64.Type),
#"Unpivoted Other Columns" = Table.UnpivotOtherColumns(#"Added Index", {"Index"}, "Columns", "Value"),
#"Added Custom" = Table.AddColumn(#"Unpivoted Other Columns", "Group", each if [Columns] ="UID" or [Columns]= "Name" then "group 0" else if [Columns] = "DOB" or [Columns]= "Shoe Size" or [Columns]= "Height" then "group 1" else if Text.Contains([Columns],"Favourite") then "group 2" else null)
in
#"Added Custom"
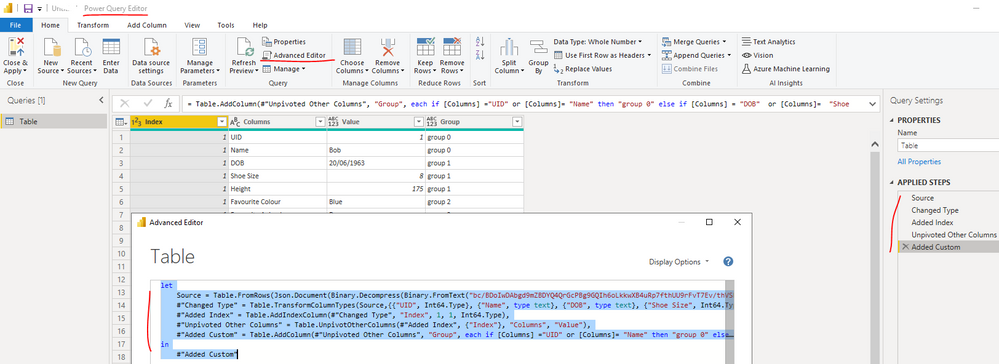
2. Create a slicer using [Group] field and matrix visual as below screenshot
Best Regards
Hi @sam_sirius ,
You can follow the steps below to achieve it:
1. Add one index column and unpivot the columns except the new index column in Power Query Editor
let
Source = Table.FromRows(Json.Document(Binary.Decompress(Binary.FromText("bc/BDoIwDAbgd9mZBDYQ4QrGcPBg9GQIh6oLkkwXB4uRp7fthUU9rFvT7Ev/thVSRKKyZ6wqiZM8lmWeYlPgkesVDY3XeG1sj7Ue3MVQux/mGUQXtUJhdwQHNyJkQJRM0OukjbGvX2QHI/QPzUzKjDFvYlTAyISdYlmlhun/Khl2W6evRKQhQSFlSfXA0y+h8q7XjglK3ICzhpEsRBSXdNmjgfs44T9c/OnBaU7gMRIm6j4=", BinaryEncoding.Base64), Compression.Deflate)), let _t = ((type nullable text) meta [Serialized.Text = true]) in type table [UID = _t, Name = _t, DOB = _t, #"Shoe Size" = _t, Height = _t, #"Favourite Colour" = _t, #"Favourite Animal" = _t, #"Favourite Shape" = _t, #"Favourite Food " = _t]),
#"Changed Type" = Table.TransformColumnTypes(Source,{{"UID", Int64.Type}, {"Name", type text}, {"DOB", type text}, {"Shoe Size", Int64.Type}, {"Height", Int64.Type}, {"Favourite Colour", type text}, {"Favourite Animal", type text}, {"Favourite Shape", type text}, {"Favourite Food ", type text}}),
#"Added Index" = Table.AddIndexColumn(#"Changed Type", "Index", 1, 1, Int64.Type),
#"Unpivoted Other Columns" = Table.UnpivotOtherColumns(#"Added Index", {"Index"}, "Columns", "Value"),
#"Added Custom" = Table.AddColumn(#"Unpivoted Other Columns", "Group", each if [Columns] ="UID" or [Columns]= "Name" then "group 0" else if [Columns] = "DOB" or [Columns]= "Shoe Size" or [Columns]= "Height" then "group 1" else if Text.Contains([Columns],"Favourite") then "group 2" else null)
in
#"Added Custom"
2. Create a slicer using [Group] field and matrix visual as below screenshot
Best Regards
Hi,
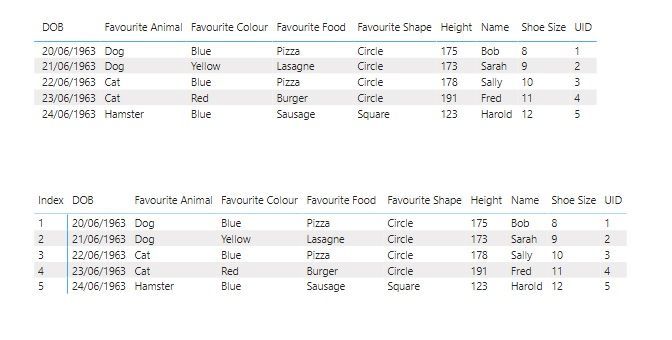
In the Matrix visualization pane, you have added an index column in the Rows field.
But it is not displayed in Matrix visual.
Can you please explain the logic behind that?🤔
Pls refer to the below images,
The 1st Matrix from your Pbi file.
2nd Matrix is my own( 1st column showing the index column)
Thank you in advance.
Thank you, very helpful!
Check out the May 2026 Power BI update to learn about new features.
Sign up to receive a private message when registration opens and key events begin.
If you have recently started exploring Fabric, we'd love to hear how it's going. Your feedback can help with product improvements.
| User | Count |
|---|---|
| 27 | |
| 25 | |
| 22 | |
| 20 | |
| 14 |
| User | Count |
|---|---|
| 51 | |
| 47 | |
| 23 | |
| 18 | |
| 18 |