cancel
Showing results for 
Search instead for 
Did you mean: 

A new Data Days event is coming soon! This time we’re going bigger than ever. Fabric, Power BI, SQL, AI and more. Don't miss out.

Reply
sam_sirius
Regular Visitor

Create a table visual with dynamic columns

Hello all,


I am trying to create a table visual in which the user can choose which columns they view via a slicer. I have a spreadsheet with 26 columns, and they thematically can be grouped together into 9 groups. So ideally the user could choose 'group 1' from the slicer and all group 1 columns will populate the table.


For example, say we have the following table:


UID

Name

DOB

Shoe Size

Height

Favourite Colour

Favourite Animal

Favourite Shape

Favourite Food 

1

Bob

20/06/1963

8

175

Blue

Dog

Circle

Pizza

2

Sarah

21/06/1963

9

173

Yellow

Dog

Circle

Lasagne

3

Sally

22/06/1963

10

178

Blue

Cat

Circle

Pizza

4

Fred

23/06/1963

11

191

Red

Cat

Circle

Burger

5

Harold

24/06/1963

12

123

Blue

Hamster

Square

Sausage


I would like to have two permanent columns (group zero) that contain UID and Name. I would then like to designate DOB, Shoe Size, and Height as ‘Basic Information’ (group 1) and the Favourite columns as ‘Favourite things’ (group 2). I would then like to be able to choose which group of columns to view via a slicer.


I have had a deep dive into this and have not been able to find anything that quite matches what I am after. I am happy to be pointed in the direction of any solved solutions or training that is relevant. Any and all help would be greatly appreciated.


Thanks in advanced!

1 ACCEPTED SOLUTION
Anonymous
Not applicable

Hi @sam_sirius ,

You can follow the steps below to achieve it:

1. Add one index column and unpivot the columns except the new index column in Power Query Editor

let
    Source = Table.FromRows(Json.Document(Binary.Decompress(Binary.FromText("bc/BDoIwDAbgd9mZBDYQ4QrGcPBg9GQIh6oLkkwXB4uRp7fthUU9rFvT7Ev/thVSRKKyZ6wqiZM8lmWeYlPgkesVDY3XeG1sj7Ue3MVQux/mGUQXtUJhdwQHNyJkQJRM0OukjbGvX2QHI/QPzUzKjDFvYlTAyISdYlmlhun/Khl2W6evRKQhQSFlSfXA0y+h8q7XjglK3ICzhpEsRBSXdNmjgfs44T9c/OnBaU7gMRIm6j4=", BinaryEncoding.Base64), Compression.Deflate)), let _t = ((type nullable text) meta [Serialized.Text = true]) in type table [UID = _t, Name = _t, DOB = _t, #"Shoe Size" = _t, Height = _t, #"Favourite Colour" = _t, #"Favourite Animal" = _t, #"Favourite Shape" = _t, #"Favourite Food " = _t]),
    #"Changed Type" = Table.TransformColumnTypes(Source,{{"UID", Int64.Type}, {"Name", type text}, {"DOB", type text}, {"Shoe Size", Int64.Type}, {"Height", Int64.Type}, {"Favourite Colour", type text}, {"Favourite Animal", type text}, {"Favourite Shape", type text}, {"Favourite Food ", type text}}),
    #"Added Index" = Table.AddIndexColumn(#"Changed Type", "Index", 1, 1, Int64.Type),
    #"Unpivoted Other Columns" = Table.UnpivotOtherColumns(#"Added Index", {"Index"}, "Columns", "Value"),
    #"Added Custom" = Table.AddColumn(#"Unpivoted Other Columns", "Group", each if [Columns] ="UID" or [Columns]= "Name" then "group 0" else if [Columns] = "DOB"  or [Columns]=  "Shoe Size" or [Columns]= "Height" then "group 1" else if Text.Contains([Columns],"Favourite") then "group 2" else null)
in
    #"Added Custom"
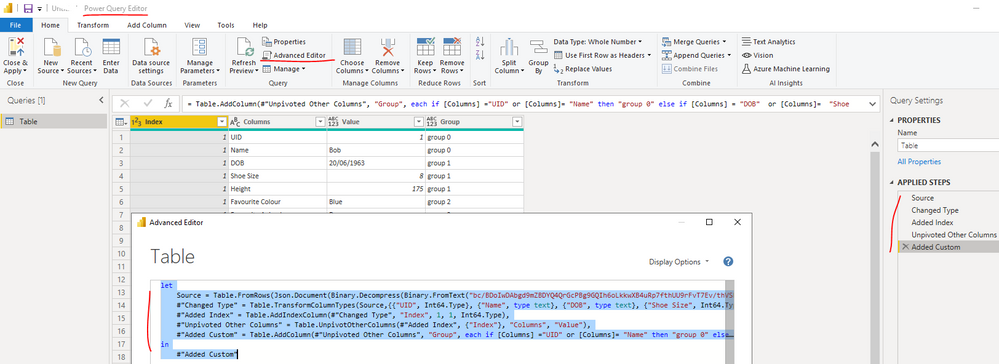
yingyinr_0-1670314752424.png

2. Create a slicer using [Group] field and matrix visual as below screenshot

yingyinr_1-1670314863912.png

Best Regards

View solution in original post

3 REPLIES 3
Anonymous
Not applicable

Hi @sam_sirius ,

You can follow the steps below to achieve it:

1. Add one index column and unpivot the columns except the new index column in Power Query Editor

let
    Source = Table.FromRows(Json.Document(Binary.Decompress(Binary.FromText("bc/BDoIwDAbgd9mZBDYQ4QrGcPBg9GQIh6oLkkwXB4uRp7fthUU9rFvT7Ev/thVSRKKyZ6wqiZM8lmWeYlPgkesVDY3XeG1sj7Ue3MVQux/mGUQXtUJhdwQHNyJkQJRM0OukjbGvX2QHI/QPzUzKjDFvYlTAyISdYlmlhun/Khl2W6evRKQhQSFlSfXA0y+h8q7XjglK3ICzhpEsRBSXdNmjgfs44T9c/OnBaU7gMRIm6j4=", BinaryEncoding.Base64), Compression.Deflate)), let _t = ((type nullable text) meta [Serialized.Text = true]) in type table [UID = _t, Name = _t, DOB = _t, #"Shoe Size" = _t, Height = _t, #"Favourite Colour" = _t, #"Favourite Animal" = _t, #"Favourite Shape" = _t, #"Favourite Food " = _t]),
    #"Changed Type" = Table.TransformColumnTypes(Source,{{"UID", Int64.Type}, {"Name", type text}, {"DOB", type text}, {"Shoe Size", Int64.Type}, {"Height", Int64.Type}, {"Favourite Colour", type text}, {"Favourite Animal", type text}, {"Favourite Shape", type text}, {"Favourite Food ", type text}}),
    #"Added Index" = Table.AddIndexColumn(#"Changed Type", "Index", 1, 1, Int64.Type),
    #"Unpivoted Other Columns" = Table.UnpivotOtherColumns(#"Added Index", {"Index"}, "Columns", "Value"),
    #"Added Custom" = Table.AddColumn(#"Unpivoted Other Columns", "Group", each if [Columns] ="UID" or [Columns]= "Name" then "group 0" else if [Columns] = "DOB"  or [Columns]=  "Shoe Size" or [Columns]= "Height" then "group 1" else if Text.Contains([Columns],"Favourite") then "group 2" else null)
in
    #"Added Custom"

yingyinr_0-1670314752424.png

2. Create a slicer using [Group] field and matrix visual as below screenshot

yingyinr_1-1670314863912.png

Best Regards

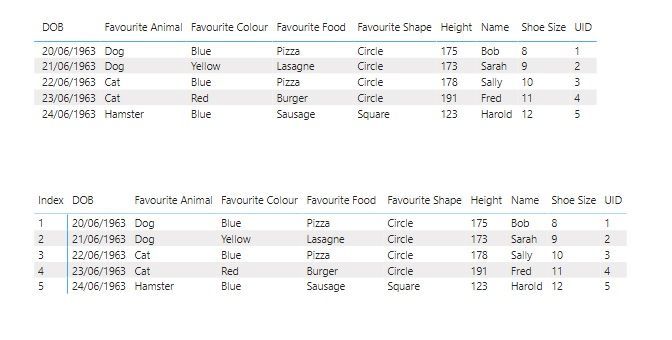
Hi,

In the Matrix visualization pane, you have added an index column in the Rows field.

But it is not displayed in Matrix visual.

Can you please explain the logic behind that?🤔

Pls refer to the below images, Create a table visual with dynamic columns image.jpg

The 1st Matrix from your Pbi file.

2nd Matrix is my own( 1st column showing the index column)

Thank you in advance.

Thank you, very helpful!

Helpful resources

Announcements
May Power BI Update Carousel

Power BI Monthly Update - May 2026

Check out the May 2026 Power BI update to learn about new features.

Fabric SQL PBI Data Days

Data Days 2026 coming soon!

Sign up to receive a private message when registration opens and key events begin.

New to Fabric survey Carousel

New to Fabric Survey

If you have recently started exploring Fabric, we'd love to hear how it's going. Your feedback can help with product improvements.

Power BI DataViz World Championships carousel

Power BI DataViz World Championships - June 2026

A new Power BI DataViz World Championship is coming this June! Don't miss out on submitting your entry.