This is best Fabric, Power BI, SQL and AI community event. How do we know? The last event sold out! Save €200 with code FABCMTY200.
Register nowA new Data Days event is coming soon! This time we’re going bigger than ever. Fabric, Power BI, SQL, AI and more. Don't miss out.
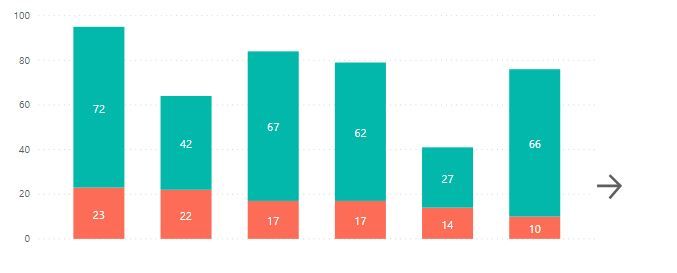
Create a chart with navigation, where it shows only some data, and as the user clicks on the arrow, more information appears.
Solved! Go to Solution.
Aside from bookmarks with buttons, you can try drillthrough functionality - https://docs.microsoft.com/en-us/power-bi/desktop-drillthrough. It will allow you to go to a tab with more detailed visual.
Regards,
Ruslan Zolotukhin (zoloturu)
BI Engineer at Akvelon Inc. / Kharkiv Power BI User Group Leader / DAX & Power BI Trainer
-------------------------------------------------------------------
Did I answer your question? Mark my post as a solution!
It was useful? Press Thumbs Up!
You are from Ukraine? If yes then welcome to Power BI User Group - KhPUG website. Other country? Check and find proper one - Power BI User Groups
1. Create a button with arrow sign.
2. Create an another visual with expanded data.
3. Create a bookmark, where all visuals will be visible except the expanded one. Use Selection Pane to set visibility.
4. Assign a bookmark to the button.
That's it.
If you would need a button to return back, then repeat all steps, but don't forget to set visible/hidden property to visuals at each bookmark.
Regards,
Ruslan Zolotukhin (zoloturu)
BI Engineer at Akvelon Inc. / Kharkiv Power BI User Group Leader / DAX & Power BI Trainer
-------------------------------------------------------------------
Did I answer your question? Mark my post as a solution!
It was useful? Press Thumbs Up!
You are from Ukraine? If yes then welcome to Power BI User Group - KhPUG website. Other country? Check and find proper one - Power BI User Groups
The problem is that I need an automatic solution. I will replicate the dashboard on different bases. Doing something customized for each one would not be feasible.
Aside from bookmarks with buttons, you can try drillthrough functionality - https://docs.microsoft.com/en-us/power-bi/desktop-drillthrough. It will allow you to go to a tab with more detailed visual.
Regards,
Ruslan Zolotukhin (zoloturu)
BI Engineer at Akvelon Inc. / Kharkiv Power BI User Group Leader / DAX & Power BI Trainer
-------------------------------------------------------------------
Did I answer your question? Mark my post as a solution!
It was useful? Press Thumbs Up!
You are from Ukraine? If yes then welcome to Power BI User Group - KhPUG website. Other country? Check and find proper one - Power BI User Groups
Check out the May 2026 Power BI update to learn about new features.
Sign up to receive a private message when registration opens and key events begin.
If you have recently started exploring Fabric, we'd love to hear how it's going. Your feedback can help with product improvements.
| User | Count |
|---|---|
| 32 | |
| 25 | |
| 23 | |
| 22 | |
| 13 |
| User | Count |
|---|---|
| 61 | |
| 47 | |
| 27 | |
| 24 | |
| 19 |