This is best Fabric, Power BI, SQL and AI community event. How do we know? The last event sold out! Save €200 with code FABCMTY200.
Register nowThe Fabric community is now in read-only for platform upgrade. Learn more
Hey Team,
I am new to PBI. I have a table where the data are available as below.
| Sex | Population |
| Male | 20 |
| Male | 10 |
| Female | 30 |
| Trangender | 5 |
| Female | 30 |
| Trangender | 10 |
I need to get the percentage contribution of Male w.r.t Total Population and Male population w.r.t Transgender population.
Can anyone help me!
Solved! Go to Solution.
Possibly issue with the Google Drive. I am still getting error.
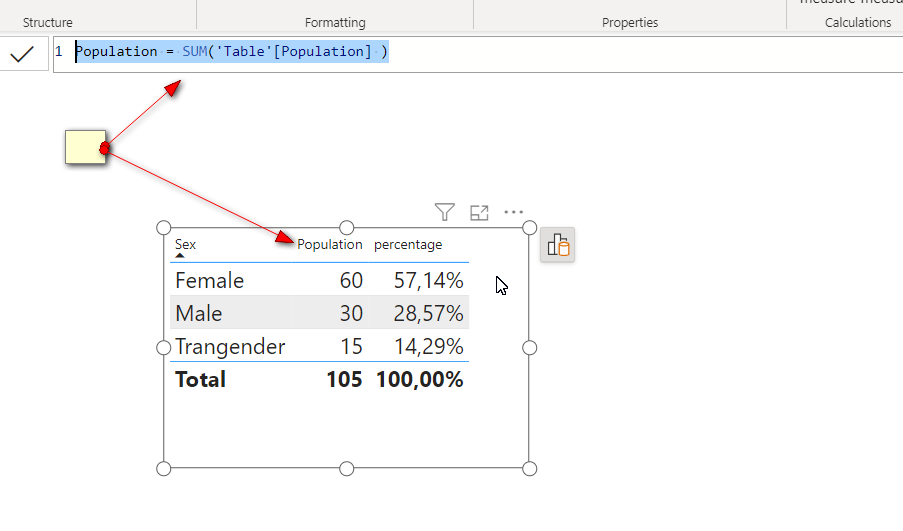
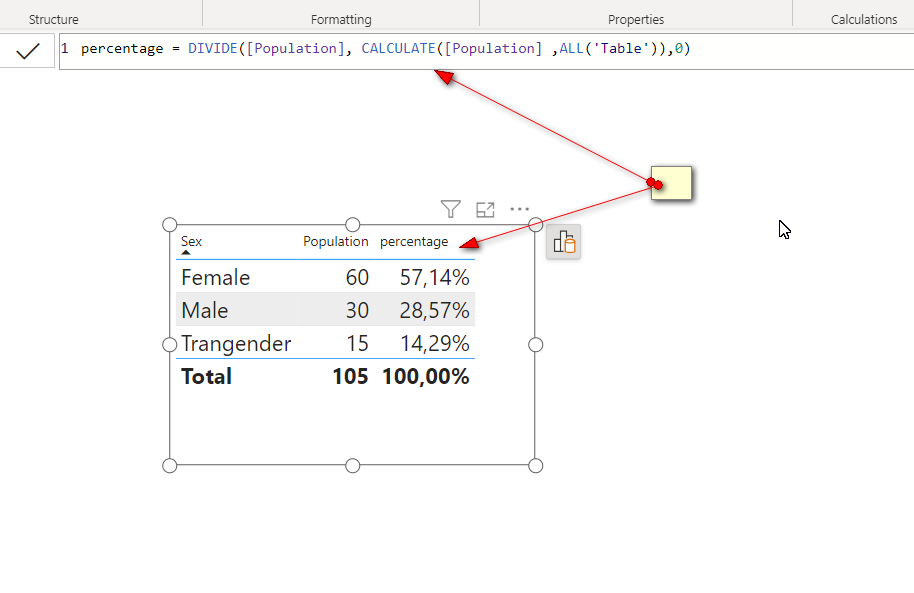
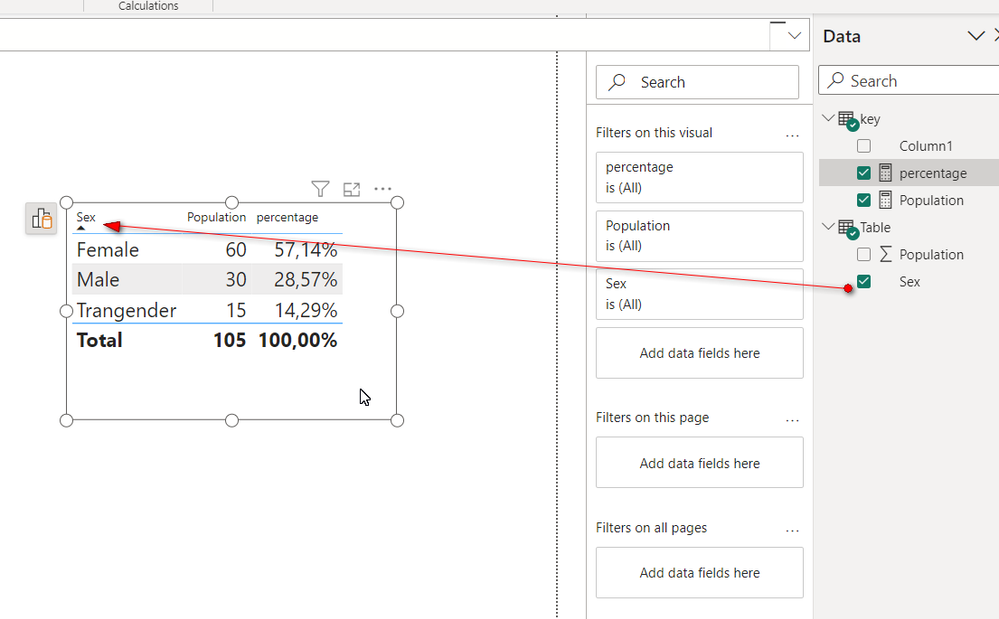
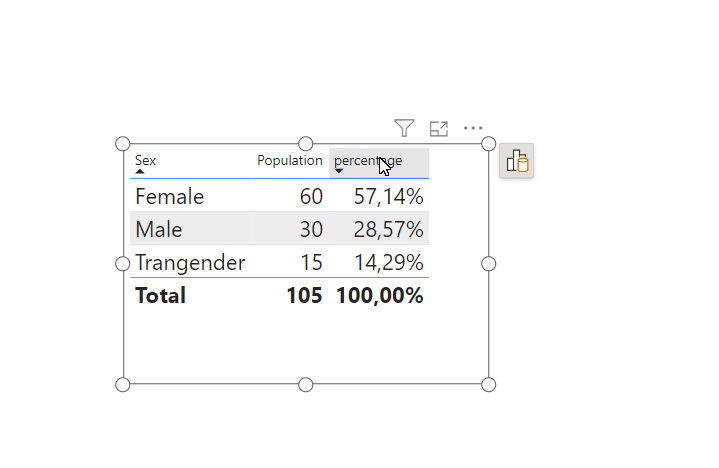
Based on your description, I created data to reproduce your scenario. The pbix file is attached in the end.
https://1drv.ms/u/s!AiUZ0Ws7G26RiSls5sxWe1b2z-fx?e=sadPEa
unable to get the Pbix file. It seems no access to the file.
Join us in Barcelona for FabCon and SQLCon, the Fabric, Power BI, SQL, and AI community event. Save €200 with code FABCMTY200.
| User | Count |
|---|---|
| 23 | |
| 22 | |
| 14 | |
| 14 | |
| 13 |
| User | Count |
|---|---|
| 47 | |
| 39 | |
| 24 | |
| 20 | |
| 20 |