cancel
Showing results for 
Search instead for 
Did you mean: 

July 7 - July 17 | Round 2 of the Power BI Dataviz World Championships. Don't miss your chance! Learn more

Reply
Socrates
Frequent Visitor

Count Rows by multiple conditions

Hello


I'm having the below problem I just can't seem to get my head around. I know the solution is simple but I'm having a complete mental block as to what it could be.


Data is set out like:


Number PlateSite
NP 1Site 1
NP 2Site 2
NP 3Site 3
NP 4Site 1
NP 1Site 2
NP 2Site 1
NP 2Site 3
NP 1Site 1
NP 3

Site 1

NP 4

Site 1


I'd like to count the number plates that have parked at more that one site (could be two, could be all three), ignoring those that have only parked at one (even multiple times). So I'd have an output matrix (or any other visual) like this:


Number PlateSite 1Site 2Site 3
NP 121 
NP 2111
NP 31 1


Thank you

1 ACCEPTED SOLUTION
Anonymous
Not applicable

I have used the following logic:

more than 2 sites = 
VAR __validation = IF( CALCULATE( DISTINCTCOUNT('Table'[Site]); ALL( 'Table'[Site])) > 1; TRUE(); FALSE())

RETURN
    IF(
        __validation;
        COUNTROWS( 'Table');
        BLANK()
    )

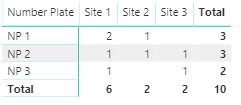
Which returns the following matrix

test.PNG

If this also works for you then please mark it as the solution. Kudos is also appreciated Smiley Happy

View solution in original post

4 REPLIES 4
Anonymous
Not applicable

I have used the following logic:

more than 2 sites = 
VAR __validation = IF( CALCULATE( DISTINCTCOUNT('Table'[Site]); ALL( 'Table'[Site])) > 1; TRUE(); FALSE())

RETURN
    IF(
        __validation;
        COUNTROWS( 'Table');
        BLANK()
    )

Which returns the following matrix

test.PNG

If this also works for you then please mark it as the solution. Kudos is also appreciated Smiley Happy

Yes! That's it, thank you. I was doing similar but doing the count on the wrong column. 

AlB
Community Champion
Community Champion

Hi @Socrates 

You can just place Number Plate and Site in the rows and columns of a matrix visual and then place Site in values, selecting Count (i.e., implicit measure) or create an explicit measure and place it in values:

Measure = COUNT(Table1[Site])  


popov
Resolver III
Resolver III

Hello, @Socrates 

Create measure like this:

Count = COUNTROWS(<YourTableName>)
And add this measure in matrix, in rows place column Number Plate, in columns place column Site

Helpful resources

Announcements
FabCon and SQLCon Barcelona 2026

FabCon & SQLCon – Barcelona 2026

Join us in Barcelona for FabCon and SQLCon, the Fabric, Power BI, SQL, and AI community event. Save €200 with code FABCMTY200.

60 days of Data Days Carousel

Data Days 2026

Join Fabric Data Days 2026: 60 days of free live/on-demand sessions, challenges, study groups, and certification opportunities.

Power BI DataViz World Championships carousel

Power BI DataViz World Championships - June 2026

A new Power BI DataViz World Championship is coming this June! Don't miss out on submitting your entry.