Forum Discussion

Converting Logic From Excel to Power BI
I need some help transferring some Excel logic into Power BI. Basically, as you can see in the picture below, I want two seperate classifications in the form of calculated columns. The first, "Classification", is the original start of that user based on when they first had revenue. However, there is a slight twist to this. As you can see in User 3 their classification returns "Mar-20" because in my forumla I have set it up so that if a user dosen't have any revenue 12 months after their last revenue month (I.E. Mar-19 to Feb-20) then reclassify this user once he does revenue again. In this case, it happens to be Mar-20.
The second classifier, "Usage Status", is just simple forumla that looks in the past twelve months (in this case Apr-19 to Mar-20) to see if a User's revenue is greater than 0. If it is, then return "active" otherwise return "inactive."
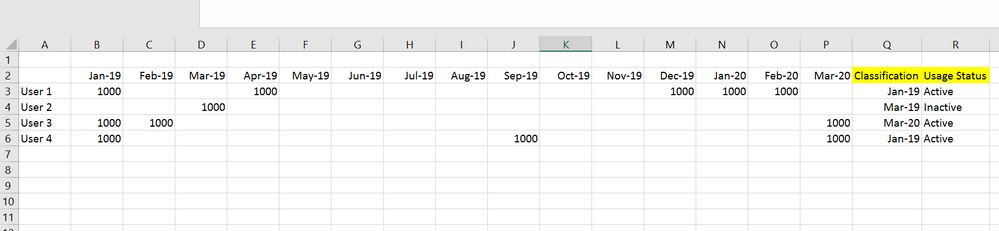
Can you make both of these classifications as calculated columns in Power BI? The way my data is set up in Power BI is not like Excel. In Power BI, I will be refrencing a sales table that follows a layout like the screenshot below (more of a columnar format rather than a crosstab format in my example above):
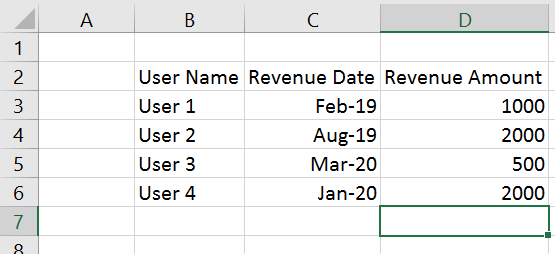
Appreciate all the help on this. Let me know if you need more info!
Please refer to this post for the answer:
2 Replies
 jthomsonSolution Sage
Should be doable. Think the key bit would be to convert the month into something like 202003 for March 20, then try grouping by user in Power Query by the maximum and minimum of that column - the minimum would be your classification, the maximum would be the last time they had revenue, then you can add 1000 to the maximum to work out an inactive date?
 WkeithHelper II
Please refer to this post for the answer: