cancel
Showing results for 
Search instead for 
Did you mean: 

July 7 - July 17 | Round 2 of the Power BI Dataviz World Championships. Don't miss your chance! Learn more

Reply
Anonymous
Not applicable

Conditional formatting in cluster column chart.

Hello Everyone,

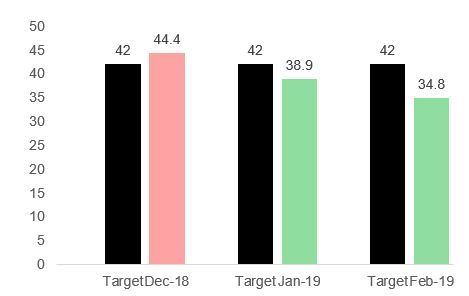
I have a clustered column chart, with 2 data set. One is target and other is value.

If the value goes above the target then the color of that bar chart must change to red, if not than green. (Refer attached screenshot).

If there any ways to achieve this in power BI?

Appreciate your support.


Regards,

SaadExample Graph.JPG

1 ACCEPTED SOLUTION
Anonymous
Not applicable

Hi @Anonymous ,

AFAIK, conditional formatting feature current only works on table and matrix visual. Maybe you can refer to following link to use advanced color control to use formula to conditional your data color:

Data Colors Advanced Controls, November 2018 release

Regards,

Xiaoxin Sheng

View solution in original post

2 REPLIES 2
Anonymous
Not applicable

Hi @Anonymous ,

AFAIK, conditional formatting feature current only works on table and matrix visual. Maybe you can refer to following link to use advanced color control to use formula to conditional your data color:

Data Colors Advanced Controls, November 2018 release

Regards,

Xiaoxin Sheng

Anonymous
Not applicable

Thanks i will go through that info

Helpful resources

Announcements
FabCon and SQLCon Barcelona 2026

FabCon & SQLCon – Barcelona 2026

Join us in Barcelona for FabCon and SQLCon, the Fabric, Power BI, SQL, and AI community event. Save €200 with code FABCMTY200.

60 days of Data Days Carousel

Data Days 2026

Join Data Days 2026: 60 days of free live/on-demand sessions, challenges, study groups, and certification opportunities.

Power BI DataViz World Championships carousel

Power BI DataViz World Championships - June 2026

A new Power BI DataViz World Championship is coming this June! Don't miss out on submitting your entry.

Top Solution Authors