I have the following columns are Id, Code, Result1, Result2, Result1 colour code and Result colour code in data table.
For Result1 and Resul2 created slicer table for switch the Results in visual and the same way created measure for value columns in matrix table .
Data:
| ID | Code | Result1 | Result2 | Result colour code | Result2 colour code |
| 1S | A | Win | Id1 | Green | Green |
| 1S | A | Win | Id1 | Green | Green |
| 1S | B | Win | Id1 | Green | Green |
| 1S | C | Win | Id1 | Green | Green |
| 1S | D | Win | Id1 | Green | Green |
| 1S | D | Win | Id1 | Green | Green |
| 2S | A | Loss | Id2 | Red | Red |
| 2S | B | Loss | Id2 | Red | Red |
| 2S | C | Loss | Id2 | Red | Red |
| 2S | D | Loss | Id2 | Red | Red |
| 3S | A | Loss | Id3 | Red | Orange |
| 3S | A | Loss | Id3 | Red | Orange |
| 4S | A | Win | Id4 | Green | Yellow |
| 4S | A | Win | Id4 | Green | Yellow |
| 5S | A | Win | Id5 | Green | Purple |
| 5S | B | Win | Id5 | Green | Purple |
| 6S | C | Loss | Id6 | Red | Blue |
| 6S | D | Loss | Id6 | Red | Blue |
AlexisOlson helped for slicer and measure
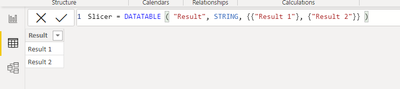
Slicer = DATATABLE ( "Result", STRING, {{"Result 1"}, {"Result 2"}} )
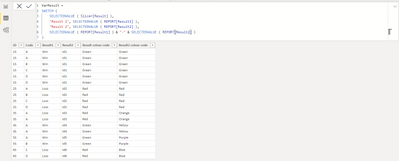
VarResult =
SWITCH (
SELECTEDVALUE ( Slicer[Result] ),
"Result 1", SELECTEDVALUE ( REPORT[Result1] ),
"Result 2", SELECTEDVALUE ( REPORT[Result2] ),
SELECTEDVALUE ( REPORT[Result1] ) & "-" & SELECTEDVALUE ( REPORT[Result2] )
)
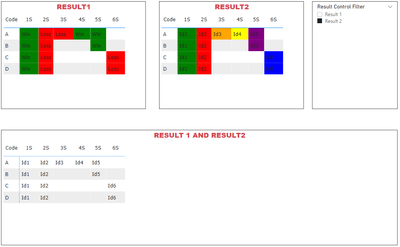
If I selected the Result1 status in slicer table then it will reflect Result1 status and row/columns only and the same thing for Result2.
Now my question is how can I apply the conditional according to the result.
Measure:
Slicer
PBI file attached.
https://www.dropbox.com/s/rpesne9daxq45j6/Materix%20multiple%20visual%20on%20value%20column.pbix?dl=...


