cancel
Showing results for 
Search instead for 
Did you mean: 

July 28 - August 9 | Final Round of the Power BI Dataviz World Championships. This is your chance. Learn more

Reply
aAmirkHan
Helper III
Helper III

Conditional Formatting with Field Parameter

Hi,


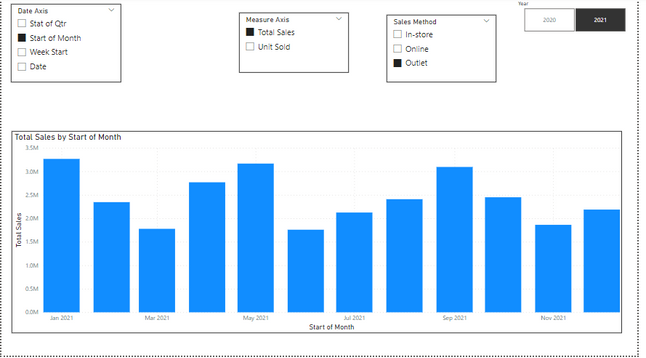
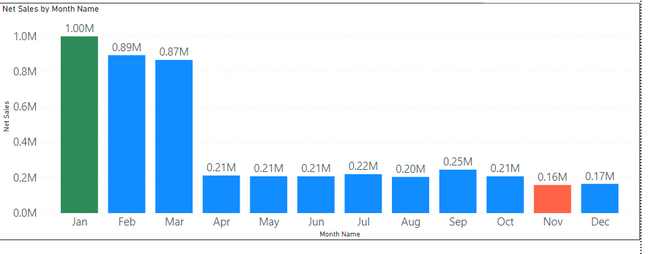
I want to get Dynamic color Green for Maximum value and Red for Minimum value in my column chart with field parameter.

Please advise how can it be done?

To be changed color.png

As per below example

Example.png

1 ACCEPTED SOLUTION

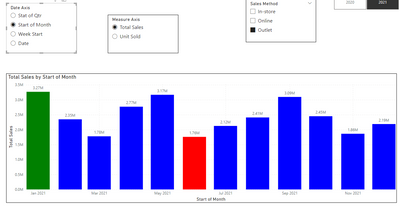
Well, this got really ugly really fast...


bar color =
VAR da =
    MAX( 'Date Axis'[Date Axis] )
VAR ma =
    MAX( 'Measure Axis'[Measure Axis] )
VAR ts =
    SWITCH( ma, "Total Sales", [Total Sales], "Unit Sold", [Unit Sold] )
VAR mv0 =
    CALCULATETABLE(
        SUMMARIZE(
            'Date',
            [Stat of Qtr],
            "v", SWITCH( ma, "Total Sales", [Total Sales], "Unit Sold", [Unit Sold] )
        ),
        ALLSELECTED()
    )
VAR mv1 =
    CALCULATETABLE(
        SUMMARIZE(
            'Date',
            [Start of Month],
            "v", SWITCH( ma, "Total Sales", [Total Sales], "Unit Sold", [Unit Sold] )
        ),
        ALLSELECTED()
    )
VAR mv2 =
    CALCULATETABLE(
        SUMMARIZE(
            'Date',
            [Week Start],
            "v", SWITCH( ma, "Total Sales", [Total Sales], "Unit Sold", [Unit Sold] )
        ),
        ALLSELECTED()
    )
VAR mv3 =
    CALCULATETABLE(
        SUMMARIZE(
            'Date',
            [Date],
            "v", SWITCH( ma, "Total Sales", [Total Sales], "Unit Sold", [Unit Sold] )
        ),
        ALLSELECTED()
    )
RETURN
    SWITCH(
        da,
        "Stat of Qtr",
            SWITCH(
                TRUE(),
                ts = MAXX( mv0, [v] ), "green",
                ts = MINX( mv0, [v] ), "red",
                "blue"
            ),
        "Start of Month",
            SWITCH(
                TRUE(),
                ts = MAXX( mv1, [v] ), "green",
                ts = MINX( mv1, [v] ), "red",
                "blue"
            ),
        "Week Start",
            SWITCH(
                TRUE(),
                ts = MAXX( mv2, [v] ), "green",
                ts = MINX( mv2, [v] ), "red",
                "blue"
            ),
        "Date",
            SWITCH(
                TRUE(),
                ts = MAXX( mv3, [v] ), "green",
                ts = MINX( mv3, [v] ), "red",
                "blue"
            )
    )


lbendlin_0-1689202341200.png

see attached

View solution in original post

5 REPLIES 5
lbendlin
Super User
Super User

Please provide sample data (with sensitive information removed) that covers your issue or question completely, in a usable format (not as a screenshot).
https://community.fabric.microsoft.com/t5/Community-Blog/How-to-provide-sample-data-in-the-Power-BI-...

Thank you for your response.

Please refer the attached file as per your requirement.

PBIX File & Data Set

Well, this got really ugly really fast...


bar color =
VAR da =
    MAX( 'Date Axis'[Date Axis] )
VAR ma =
    MAX( 'Measure Axis'[Measure Axis] )
VAR ts =
    SWITCH( ma, "Total Sales", [Total Sales], "Unit Sold", [Unit Sold] )
VAR mv0 =
    CALCULATETABLE(
        SUMMARIZE(
            'Date',
            [Stat of Qtr],
            "v", SWITCH( ma, "Total Sales", [Total Sales], "Unit Sold", [Unit Sold] )
        ),
        ALLSELECTED()
    )
VAR mv1 =
    CALCULATETABLE(
        SUMMARIZE(
            'Date',
            [Start of Month],
            "v", SWITCH( ma, "Total Sales", [Total Sales], "Unit Sold", [Unit Sold] )
        ),
        ALLSELECTED()
    )
VAR mv2 =
    CALCULATETABLE(
        SUMMARIZE(
            'Date',
            [Week Start],
            "v", SWITCH( ma, "Total Sales", [Total Sales], "Unit Sold", [Unit Sold] )
        ),
        ALLSELECTED()
    )
VAR mv3 =
    CALCULATETABLE(
        SUMMARIZE(
            'Date',
            [Date],
            "v", SWITCH( ma, "Total Sales", [Total Sales], "Unit Sold", [Unit Sold] )
        ),
        ALLSELECTED()
    )
RETURN
    SWITCH(
        da,
        "Stat of Qtr",
            SWITCH(
                TRUE(),
                ts = MAXX( mv0, [v] ), "green",
                ts = MINX( mv0, [v] ), "red",
                "blue"
            ),
        "Start of Month",
            SWITCH(
                TRUE(),
                ts = MAXX( mv1, [v] ), "green",
                ts = MINX( mv1, [v] ), "red",
                "blue"
            ),
        "Week Start",
            SWITCH(
                TRUE(),
                ts = MAXX( mv2, [v] ), "green",
                ts = MINX( mv2, [v] ), "red",
                "blue"
            ),
        "Date",
            SWITCH(
                TRUE(),
                ts = MAXX( mv3, [v] ), "green",
                ts = MINX( mv3, [v] ), "red",
                "blue"
            )
    )


lbendlin_0-1689202341200.png

see attached

Thank you @lbendlin very much for solving my problem!

Anonymous
Not applicable

You may use this measure for your desired output, I've used a different dataset so change it accordingly
 
DataMarker =
VAR Pr =
    SELECTEDVALUE ( Financials[Product] )
VAR MinSales =
    CALCULATE (
        MINX (
            ALLSELECTED ( Financials[MonthName], Financials[MonthNumber] ),
            [TotalSales]
        )
    )
VAR MaxSales =
    CALCULATE (
        MAXX (
            ALLSELECTED ( Financials[MonthName], Financials[MonthNumber] ),
            [TotalSales]
        )
    )
VAR CurrentSales = [TotalSales]
RETURN
    SWITCH ( TRUE (), CurrentSales = MaxSales, "Green", CurrentSales = MinSales, "Red" )

Helpful resources

Announcements
FabCon and SQLCon Barcelona 2026

FabCon & SQLCon – Barcelona 2026

Join us in Barcelona for FabCon and SQLCon, the Fabric, Power BI, SQL, and AI community event. Save €200 with code FABCMTY200.

Fabric Community Sticker Design Challenge Barcelona Carousel

Fabric Community Sticker Challenge - Barcelona 2026

If you love stickers, then you will definitely want to check out our community sticker challenge, Barcelona edition!

July Power BI Update Carousel

Power BI Monthly Update - July 2026

Check out the July 2026 Power BI update to learn about new features.

Power BI DataViz World Championships carousel

Power BI DataViz World Championships - June 2026

A new Power BI DataViz World Championship is coming this June! Don't miss out on submitting your entry.