Huge last-minute discounts for FabCon Vienna from September 15-18, 2025
Supplies are limited. Contact info@espc.tech right away to save your spot before the conference sells out.
Get your discount- Power BI forums
- Get Help with Power BI
- Desktop
- Service
- Report Server
- Power Query
- Mobile Apps
- Developer
- DAX Commands and Tips
- Custom Visuals Development Discussion
- Health and Life Sciences
- Power BI Spanish forums
- Translated Spanish Desktop
- Training and Consulting
- Instructor Led Training
- Dashboard in a Day for Women, by Women
- Galleries
- Data Stories Gallery
- Themes Gallery
- Contests Gallery
- Quick Measures Gallery
- Notebook Gallery
- Translytical Task Flow Gallery
- TMDL Gallery
- R Script Showcase
- Webinars and Video Gallery
- Ideas
- Custom Visuals Ideas (read-only)
- Issues
- Issues
- Events
- Upcoming Events
Score big with last-minute savings on the final tickets to FabCon Vienna. Secure your discount
- Power BI forums
- Forums
- Get Help with Power BI
- Desktop
- Re: Conditional Formatting not showing colours cor...
- Subscribe to RSS Feed
- Mark Topic as New
- Mark Topic as Read
- Float this Topic for Current User
- Bookmark
- Subscribe
- Printer Friendly Page
- Mark as New
- Bookmark
- Subscribe
- Mute
- Subscribe to RSS Feed
- Permalink
- Report Inappropriate Content
Conditional Formatting not showing colours correctly
Hi there
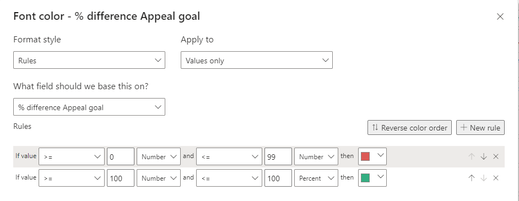
I am trying to highlight the font of anything below 100% as red and anything 100% or over as Green but its not work correctly for me. Below is my configuration:
Can someone help please as I am sure I am doing something incorrectly here but cannot see what.
Solved! Go to Solution.
- Mark as New
- Bookmark
- Subscribe
- Mute
- Subscribe to RSS Feed
- Permalink
- Report Inappropriate Content
Hmmm okay, try changing the green row to :
> 1 Number and <= 100 Percent
If I answered your question, please mark my post as solution, Appreciate your Kudos 👍
- Mark as New
- Bookmark
- Subscribe
- Mute
- Subscribe to RSS Feed
- Permalink
- Report Inappropriate Content
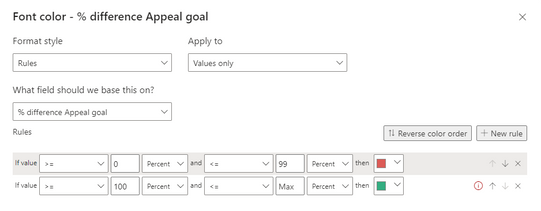
Ah yes good spot. However after changing that it still not working as there is an exclamation mark next to it and when I hover my mouse over that icon it says "Please check the logic of this rule".
- Mark as New
- Bookmark
- Subscribe
- Mute
- Subscribe to RSS Feed
- Permalink
- Report Inappropriate Content
Ah yeah change the green value to > 99 and <= 100
If I answered your question, please mark my post as solution, Appreciate your Kudos 👍
- Mark as New
- Bookmark
- Subscribe
- Mute
- Subscribe to RSS Feed
- Permalink
- Report Inappropriate Content
Thank you that seemed to have worked. However one more issue is that some of my figures are greater thenat 100% as they have over performed. I cannot seem to say if its over 100% then it needs to be green?
- Mark as New
- Bookmark
- Subscribe
- Mute
- Subscribe to RSS Feed
- Permalink
- Report Inappropriate Content
Hmmm okay, try changing the green row to :
> 1 Number and <= 100 Percent
If I answered your question, please mark my post as solution, Appreciate your Kudos 👍
- Mark as New
- Bookmark
- Subscribe
- Mute
- Subscribe to RSS Feed
- Permalink
- Report Inappropriate Content
Boom! It worked thank you! I had to change the order of the rules but that is all sored now thank you so much!
- Mark as New
- Bookmark
- Subscribe
- Mute
- Subscribe to RSS Feed
- Permalink
- Report Inappropriate Content
No worries, happy to help 🙂
- Mark as New
- Bookmark
- Subscribe
- Mute
- Subscribe to RSS Feed
- Permalink
- Report Inappropriate Content
Hi,
looking at the image you have both number and percentage in the dropdown selectors for the rules. Change them all to percentage
If I answered your question, please mark my post as solution, Appreciate your Kudos 👍
Helpful resources
| User | Count |
|---|---|
| 64 | |
| 59 | |
| 47 | |
| 33 | |
| 32 |
| User | Count |
|---|---|
| 84 | |
| 75 | |
| 56 | |
| 50 | |
| 44 |


