Get certified for free when you join Fabric Data Days 2026 and dive into Fabric, Power BI, SQL, AI, and other essential data skills.
Join nowJuly 28 - August 9 | Final Round of the Power BI Dataviz World Championships. This is your chance. Learn more
I have dataset like below:-
| Col A | Col B | Value | Color |
| A | a | 1 | RED |
| A | c | 2 | |
| B | b | 3 | RED |
| C | c | 2 | RED |
| D | a | 5 | Green |
| D | c | 6 | |
| E | b | 4 | Green |
| F | a | 1 | |
| F | c | 3 | Green |
| G | b | 6 |
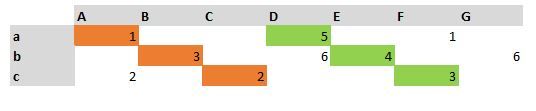
I need the output like this:-
Is there any work around to achieve this. Color Code will be assigned to the group as like (A,a), (B,b) and (C,c) and of RED groups and as per the groups the color should come into the Matrix, it should not be dependent on value. Is there any work around of achieving this may be not exactly but any alternative.
Guys please help need some idea on this, any alternative solution.
Only thing I can think of is an image underlay with transparency on your matrix. Ugh.
If you love stickers, then you will definitely want to check out our community sticker challenge, Barcelona edition!
Check out the July 2026 Power BI update to learn about new features.
| User | Count |
|---|---|
| 28 | |
| 28 | |
| 19 | |
| 19 | |
| 19 |
| User | Count |
|---|---|
| 37 | |
| 29 | |
| 18 | |
| 17 | |
| 15 |