Get certified for free when you join Fabric Data Days 2026 and dive into Fabric, Power BI, SQL, AI, and other essential data skills.
Join nowJuly 7 - July 17 | Round 2 of the Power BI Dataviz World Championships. Don't miss your chance! Learn more
Hello Power BI Users,
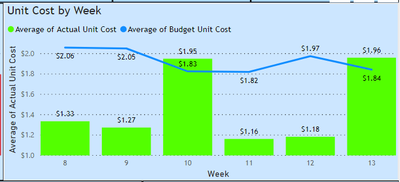
I am seeking help regarding Conditional Formatting for the Line and Clustered Column Chart attahced below. I need the columns to turn "Red" if it exceeds the budget (i.e. goes beyond the target line) and turn "Green" if it is at or under the weekly bedget (i.e. equal to or below target line).
Conditional formatting option is available in matrix and table. Is it also possible in charts and other visualizations? Kindly assist. Any inputs are much appreciated!
Thanks & Regards,
Anuj
Line & Column Chart - Turn "Red" if above target line - Conditional formatting
Solved! Go to Solution.
Hi @Anonymous ,
As the reply said above only when you have one column value then you can set conditional formatting.
You can create measure like
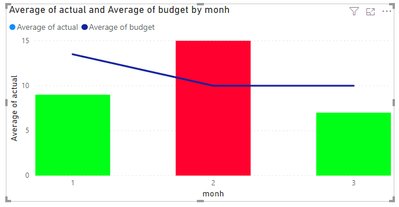
Measure = IF(AVERAGE('Table'[actual])>AVERAGE('Table'[budget]),1,0)
Then create rule as below.
Result
Best Regards,
Jay
Community Support Team _ Jay Wang
If this post helps, then please consider Accept it as the solution to help the other members find it more quickly.
Hi @Anonymous ,
As the reply said above only when you have one column value then you can set conditional formatting.
You can create measure like
Measure = IF(AVERAGE('Table'[actual])>AVERAGE('Table'[budget]),1,0)
Then create rule as below.
Result
Best Regards,
Jay
Community Support Team _ Jay Wang
If this post helps, then please consider Accept it as the solution to help the other members find it more quickly.
Hi @Anonymous
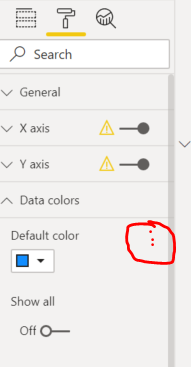
You can click on the three dots next to Default Color as below, this will expand conditional formatting, however it will only show if you have only one value in the visual.
Thank you! Enabling conditional formatting for any visual with that option is very useful.
Join us in Barcelona for FabCon and SQLCon, the Fabric, Power BI, SQL, and AI community event. Save €200 with code FABCMTY200.
Join Data Days 2026: 60 days of free live/on-demand sessions, challenges, study groups, and certification opportunities.
| User | Count |
|---|---|
| 29 | |
| 23 | |
| 18 | |
| 18 | |
| 15 |
| User | Count |
|---|---|
| 51 | |
| 44 | |
| 43 | |
| 39 | |
| 32 |