This is best Fabric, Power BI, SQL and AI community event. How do we know? The last event sold out! Save €200 with code FABCMTY200.
Register nowThe Fabric community is upgrading! Read all of the details including the timeline and what you can expect. Learn more
Hi Experts
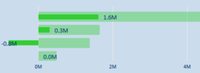
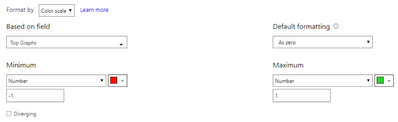
When i select a particular product from graphs A, then i should see red for negative variance and Green for Postive Variance. However i am seeing green on moves to variance see images...(not sure what i am doing wrong)
Image 1: Variance that should be red (see -0.8M)
Image 2: Conditional Formating Rule applied.
Solved! Go to Solution.
@Anonymous,
Just change from cross-highlight to cross-filter.
@Anonymous,
You might use a Slicer instead.
@Anonymous,
You may also change the Visual interactions to cross-filter.
@Anonymous,
Just change from cross-highlight to cross-filter.
Join us in Barcelona for FabCon and SQLCon, the Fabric, Power BI, SQL, and AI community event. Save €200 with code FABCMTY200.
| User | Count |
|---|---|
| 24 | |
| 22 | |
| 20 | |
| 18 | |
| 14 |
| User | Count |
|---|---|
| 31 | |
| 26 | |
| 23 | |
| 20 | |
| 20 |