Get certified for free when you join Fabric Data Days 2026 and dive into Fabric, Power BI, SQL, AI, and other essential data skills.
Join nowJuly 7 - July 17 | Round 2 of the Power BI Dataviz World Championships. Don't miss your chance! Learn more
Hi All,
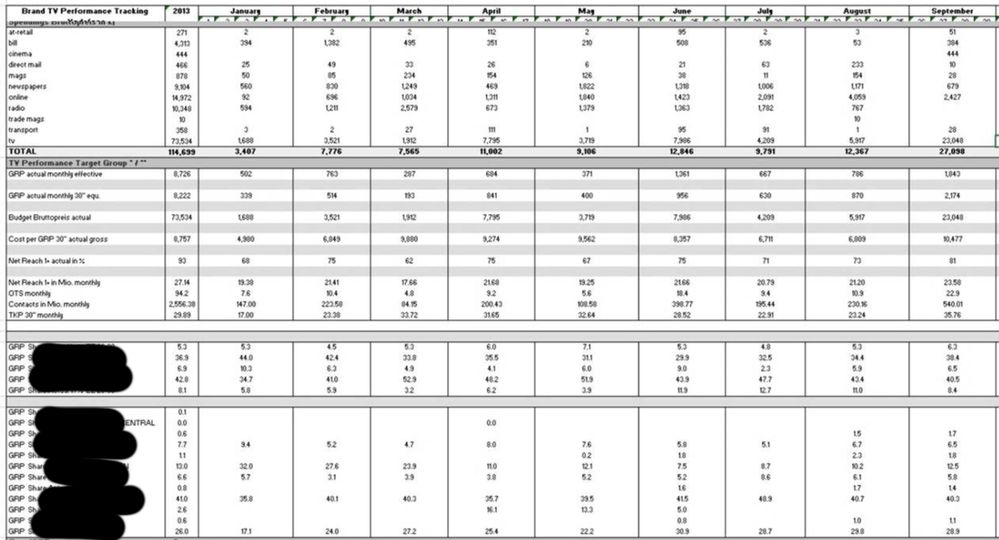
I'm looking for some cutome visual which gonna allow my to do something like the attached image.
Also, do you know how can can export this with keeping the format ??
Regards
Solved! Go to Solution.
Hi nkasdali,
Currently, this feature is still not supported in power bi. Please see this idea : https://ideas.powerbi.com/forums/265200-power-bi-ideas/suggestions/15164733-allow-table-and-matrix-d.... In addtion, as a workaround, you can create a power pivot chart in excel instead.
Regards,
Jimmy Tao
Hi nkasdali,
Currently, this feature is still not supported in power bi. Please see this idea : https://ideas.powerbi.com/forums/265200-power-bi-ideas/suggestions/15164733-allow-table-and-matrix-d.... In addtion, as a workaround, you can create a power pivot chart in excel instead.
Regards,
Jimmy Tao
Join us in Barcelona for FabCon and SQLCon, the Fabric, Power BI, SQL, and AI community event. Save €200 with code FABCMTY200.
Check out the July 2026 Power BI update to learn about new features.
Join Data Days 2026: 60 days of free live/on-demand sessions, challenges, study groups, and certification opportunities.
| User | Count |
|---|---|
| 30 | |
| 25 | |
| 25 | |
| 24 | |
| 16 |
| User | Count |
|---|---|
| 54 | |
| 37 | |
| 27 | |
| 24 | |
| 20 |