This is best Fabric, Power BI, SQL and AI community event. How do we know? The last event sold out! Save €200 with code FABCMTY200.
Register nowA new Data Days event is coming soon! This time we’re going bigger than ever. Fabric, Power BI, SQL, AI and more. Don't miss out.
Hello,
We are using a small data warehouse that contains data from an online survey, which asks people questions about their employment status. This question allows for multiple answers to be selected.
Here are an example of the anwsers that can be selected:
So 'Self employed' and 'Looking after a child under 5' can be selected together. Within our fact table these answer are represented as individual fields.
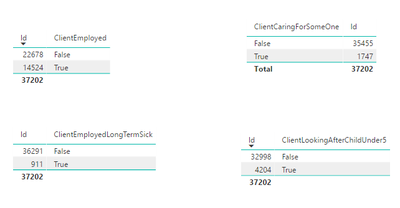
The issue that I'm having is trying to combine these fields into one visualisation and to be able to calculate totals. Here is a picture from power bi desktop of some separate fields for this question:
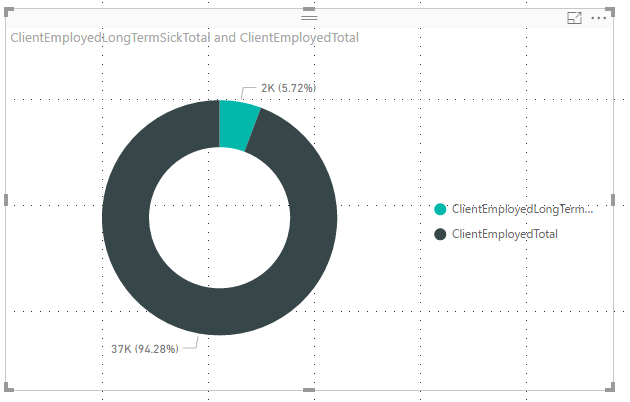
We may want a pie chart to display how many people are 'Employed' and are 'Looking after a child under 5'. This is not possible at the moment.
Does anyone have any suggestions about how to approach this?
Thanks
Solved! Go to Solution.
@Anonymous,
Do you want to count the population that are 'Employed' and also 'Looking after a child under 5'? If so, create a measure using the DAX below, then create a pie chart using the measure.
Measure = CALCULATE(COUNT(Table[id]),FILTER('Table',Table[ClientEmployed]="True" &&Table[ClientLookingAfterChildUnder5]="True"))
However, if you want to calculate the population that are 'Employed' and calculate the population that are ‘Looking after a child under 5’, then create the following measures and create pie chart using the two measures.
Measure 1 = CALCULATE(COUNT(Table[id]),FILTER('Table',Table[ClientEmployed]="True" ))
Measure 2 = CALCULATE(COUNT(Table[id]),FILTER('Table',Table[ClientLookingAfterChildUnder5]="True"))
If the above formulas don't help, please share sample data of all fields in your table and post expected result here.
Regards,
Lydia
@Anonymous,
Do you want to count the population that are 'Employed' and also 'Looking after a child under 5'? If so, create a measure using the DAX below, then create a pie chart using the measure.
Measure = CALCULATE(COUNT(Table[id]),FILTER('Table',Table[ClientEmployed]="True" &&Table[ClientLookingAfterChildUnder5]="True"))
However, if you want to calculate the population that are 'Employed' and calculate the population that are ‘Looking after a child under 5’, then create the following measures and create pie chart using the two measures.
Measure 1 = CALCULATE(COUNT(Table[id]),FILTER('Table',Table[ClientEmployed]="True" ))
Measure 2 = CALCULATE(COUNT(Table[id]),FILTER('Table',Table[ClientLookingAfterChildUnder5]="True"))
If the above formulas don't help, please share sample data of all fields in your table and post expected result here.
Regards,
Lydia
Hi Lydia,
Creating the separate measures worked. I just had to use you example without the double quotes for the True value.
Thanks for your help.
Check out the May 2026 Power BI update to learn about new features.
Sign up to receive a private message when registration opens and key events begin.
If you have recently started exploring Fabric, we'd love to hear how it's going. Your feedback can help with product improvements.
| User | Count |
|---|---|
| 26 | |
| 25 | |
| 24 | |
| 21 | |
| 14 |
| User | Count |
|---|---|
| 53 | |
| 47 | |
| 23 | |
| 18 | |
| 18 |