Fabric Data Days starts November 4th!
Advance your Data & AI career with 50 days of live learning, dataviz contests, hands-on challenges, study groups & certifications and more!
Get registered- Power BI forums
- Get Help with Power BI
- Desktop
- Service
- Report Server
- Power Query
- Mobile Apps
- Developer
- DAX Commands and Tips
- Custom Visuals Development Discussion
- Health and Life Sciences
- Power BI Spanish forums
- Translated Spanish Desktop
- Training and Consulting
- Instructor Led Training
- Dashboard in a Day for Women, by Women
- Galleries
- Data Stories Gallery
- Themes Gallery
- Contests Gallery
- Quick Measures Gallery
- Visual Calculations Gallery
- Notebook Gallery
- Translytical Task Flow Gallery
- TMDL Gallery
- R Script Showcase
- Webinars and Video Gallery
- Ideas
- Custom Visuals Ideas (read-only)
- Issues
- Issues
- Events
- Upcoming Events
Join us at FabCon Atlanta from March 16 - 20, 2026, for the ultimate Fabric, Power BI, AI and SQL community-led event. Save $200 with code FABCOMM. Register now.
- Power BI forums
- Forums
- Get Help with Power BI
- Desktop
- Re: Combine tables with columns that vary between ...
- Subscribe to RSS Feed
- Mark Topic as New
- Mark Topic as Read
- Float this Topic for Current User
- Bookmark
- Subscribe
- Printer Friendly Page
- Mark as New
- Bookmark
- Subscribe
- Mute
- Subscribe to RSS Feed
- Permalink
- Report Inappropriate Content
Combine tables with columns that vary between source files
Hello, I hoping for some guidance on a problem i have - I'm relatively new to this (but enthusiastic!)
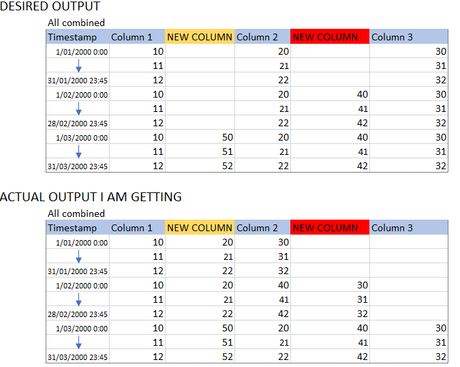
My organisation has several hundred meters which report interval consumption monthly in a large .XLSX file. My issue is that the way this file is exported does vary and when they files combine, the data is not correct. This occurs because, due to the nature of the metering on site, if meters are decommissioned, they no longer appear in the file (ie, their column is no longer there). Also, we often add meters, and these are inserted by the reporting software relative to other meters, ie, the new column could be in the middle of the dataset. I thought it best to try to represent this diagramatically, see below:

I know why this is occuring but i am unsure if this can be configured to achieve my desired output. Ideally, i would like to set this up to reference headers - i know the reasons why this is difficult (ie, non-union compatible) but i am not sure how to solve the problem - i am sure that i would not be
Desired outcome would be all files in a single folder, refreshing as new data is added and tied back to the headers for each file for subsequent analysis.
Any hints on where to start would be much appreciated - Thanks!
- Mark as New
- Bookmark
- Subscribe
- Mute
- Subscribe to RSS Feed
- Permalink
- Report Inappropriate Content
@Anonymous
You may add Table.
If this post helps, then please consider Accept it as the solution to help the other members find it more quickly.
- Mark as New
- Bookmark
- Subscribe
- Mute
- Subscribe to RSS Feed
- Permalink
- Report Inappropriate Content
Hello
thanks for your response.
I am not sure i follow how this could work. I am already promoting headers, but this still does not align the columns in the files where non-identical columns exist.
Can you elaborate at all?
Regards


