FabCon is coming to Atlanta
Join us at FabCon Atlanta from March 16 - 20, 2026, for the ultimate Fabric, Power BI, AI and SQL community-led event. Save $200 with code FABCOMM.
Register now!- Power BI forums
- Get Help with Power BI
- Desktop
- Service
- Report Server
- Power Query
- Mobile Apps
- Developer
- DAX Commands and Tips
- Custom Visuals Development Discussion
- Health and Life Sciences
- Power BI Spanish forums
- Translated Spanish Desktop
- Training and Consulting
- Instructor Led Training
- Dashboard in a Day for Women, by Women
- Galleries
- Data Stories Gallery
- Themes Gallery
- Contests Gallery
- QuickViz Gallery
- Quick Measures Gallery
- Visual Calculations Gallery
- Notebook Gallery
- Translytical Task Flow Gallery
- TMDL Gallery
- R Script Showcase
- Webinars and Video Gallery
- Ideas
- Custom Visuals Ideas (read-only)
- Issues
- Issues
- Events
- Upcoming Events
The Power BI Data Visualization World Championships is back! Get ahead of the game and start preparing now! Learn more
- Power BI forums
- Forums
- Get Help with Power BI
- Desktop
- Column Chart Sub-categories sort
- Subscribe to RSS Feed
- Mark Topic as New
- Mark Topic as Read
- Float this Topic for Current User
- Bookmark
- Subscribe
- Printer Friendly Page
- Mark as New
- Bookmark
- Subscribe
- Mute
- Subscribe to RSS Feed
- Permalink
- Report Inappropriate Content
Column Chart Sub-categories sort
Hi there,
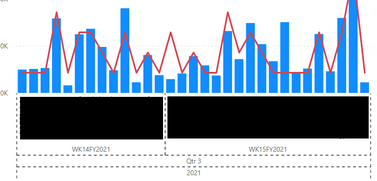
I'm really stuck trying to sort these subvalues, by value, week, quarter and year
Like:
Weeks | value
1 | 20
1 | 15
1 | 9
--------------
2 | 25
2 | 23
2 | 20
The main problem is that i just have access to the data through PBI dataflows not the original source so i could not use
an extra table or column.
I found that maybe add calculated fields could work or rankx, but still nothing works.
Thanks in advance.
- Mark as New
- Bookmark
- Subscribe
- Mute
- Subscribe to RSS Feed
- Permalink
- Report Inappropriate Content
I want this order
per week
- Mark as New
- Bookmark
- Subscribe
- Mute
- Subscribe to RSS Feed
- Permalink
- Report Inappropriate Content
I want to sort in descending order every value per week
Like
Week 1
15,14, 10
Week 2
25, 20, 19
- Mark as New
- Bookmark
- Subscribe
- Mute
- Subscribe to RSS Feed
- Permalink
- Report Inappropriate Content
Hi @Anonymous, how are you wanting to sort them? What's the end output you're after?
If I have posted a response that resolves your question, please accept it as a solution to formally close the post.
Also, if you are as passionate about Power BI, DAX and data as I am, please feel free to reach out if you have any questions, queries, or if you simply want to connect and talk to another data geek!
Want to connect?www.linkedin.com/in/theoconias
Helpful resources

Power BI Dataviz World Championships
The Power BI Data Visualization World Championships is back! Get ahead of the game and start preparing now!

| User | Count |
|---|---|
| 40 | |
| 36 | |
| 34 | |
| 31 | |
| 27 |
| User | Count |
|---|---|
| 136 | |
| 103 | |
| 66 | |
| 65 | |
| 56 |


