Join us at the 2025 Microsoft Fabric Community Conference
March 31 - April 2, 2025, in Las Vegas, Nevada. Use code MSCUST for a $150 discount! Early bird discount ends December 31.
Register Now- Power BI forums
- Get Help with Power BI
- Desktop
- Service
- Report Server
- Power Query
- Mobile Apps
- Developer
- DAX Commands and Tips
- Custom Visuals Development Discussion
- Health and Life Sciences
- Power BI Spanish forums
- Translated Spanish Desktop
- Training and Consulting
- Instructor Led Training
- Dashboard in a Day for Women, by Women
- Galleries
- Community Connections & How-To Videos
- COVID-19 Data Stories Gallery
- Themes Gallery
- Data Stories Gallery
- R Script Showcase
- Webinars and Video Gallery
- Quick Measures Gallery
- 2021 MSBizAppsSummit Gallery
- 2020 MSBizAppsSummit Gallery
- 2019 MSBizAppsSummit Gallery
- Events
- Ideas
- Custom Visuals Ideas
- Issues
- Issues
- Events
- Upcoming Events
Be one of the first to start using Fabric Databases. View on-demand sessions with database experts and the Microsoft product team to learn just how easy it is to get started. Watch now
- Power BI forums
- Forums
- Get Help with Power BI
- Desktop
- Chart data not resembling table data. Please help!
- Subscribe to RSS Feed
- Mark Topic as New
- Mark Topic as Read
- Float this Topic for Current User
- Bookmark
- Subscribe
- Printer Friendly Page
- Mark as New
- Bookmark
- Subscribe
- Mute
- Subscribe to RSS Feed
- Permalink
- Report Inappropriate Content
Chart data not resembling table data. Please help!
Hi there,
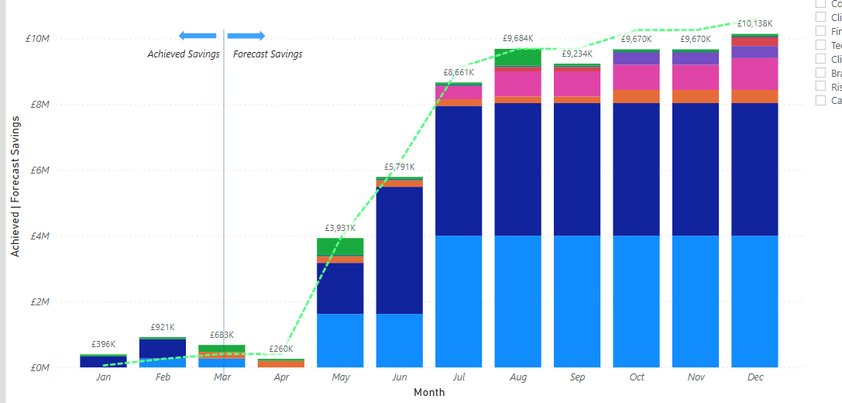
I created a measure to display actuals (if date is prior to todays date/past) and predicted values (post today/future). These values are showing as intended in a table visual (below). But when I use the measure on my combo chart (to represent the bars) these only map correctly up until today. All predicted values (although present in the table column) are wrong.
Please help. This chart uses the one measure created, which operates perfectly fine in the table. See totals on chart for comparisons.
- Mark as New
- Bookmark
- Subscribe
- Mute
- Subscribe to RSS Feed
- Permalink
- Report Inappropriate Content
@AllisonKennedy Thank you for your response.
Measure used:

- Mark as New
- Bookmark
- Subscribe
- Mute
- Subscribe to RSS Feed
- Permalink
- Report Inappropriate Content
@Anonymous How are Process Improvement Tracker and FTE Year Roadmap related?
It looks like Cumulative Deployed Savings and Year Estimate Cumulative Savings are both measures??? If so, what's the DAX for them too please?
What table is Cohort in?
I think a SUMX will likely solve your problem, but need more info to be certain.
For example:
Please @mention me in your reply if you want a response.
Copying DAX from this post? Click here for a hack to quickly replace it with your own table names
Has this post solved your problem? Please Accept as Solution so that others can find it quickly and to let the community know your problem has been solved.
If you found this post helpful, please give Kudos C
I work as a Microsoft trainer and consultant, specialising in Power BI and Power Query.
www.excelwithallison.com
- Mark as New
- Bookmark
- Subscribe
- Mute
- Subscribe to RSS Feed
- Permalink
- Report Inappropriate Content
@Anonymous We need a lot more info please. What is the DAX for your measure currently? What does the raw data model look like?
The reason it works in the table but not in the chart is that you have a different CONTEXT in both. What's in the legend of your chart? Add this to your table and you'll see it doesn't work anymore. You need to troubleshoot how that column filters the value you're displaying in the measure. Hope that helps? If you provide us with more details we can be more specific.
Please @mention me in your reply if you want a response.
Copying DAX from this post? Click here for a hack to quickly replace it with your own table names
Has this post solved your problem? Please Accept as Solution so that others can find it quickly and to let the community know your problem has been solved.
If you found this post helpful, please give Kudos C
I work as a Microsoft trainer and consultant, specialising in Power BI and Power Query.
www.excelwithallison.com
Helpful resources

Join us at the Microsoft Fabric Community Conference
March 31 - April 2, 2025, in Las Vegas, Nevada. Use code MSCUST for a $150 discount!

Microsoft Fabric Community Conference 2025
Arun Ulag shares exciting details about the Microsoft Fabric Conference 2025, which will be held in Las Vegas, NV.

| User | Count |
|---|---|
| 113 | |
| 79 | |
| 56 | |
| 55 | |
| 44 |
| User | Count |
|---|---|
| 176 | |
| 116 | |
| 77 | |
| 62 | |
| 54 |


