Get certified for free when you join Fabric Data Days 2026 and dive into Fabric, Power BI, SQL, AI, and other essential data skills.
Join nowJuly 7 - July 17 | Round 2 of the Power BI Dataviz World Championships. Don't miss your chance! Learn more
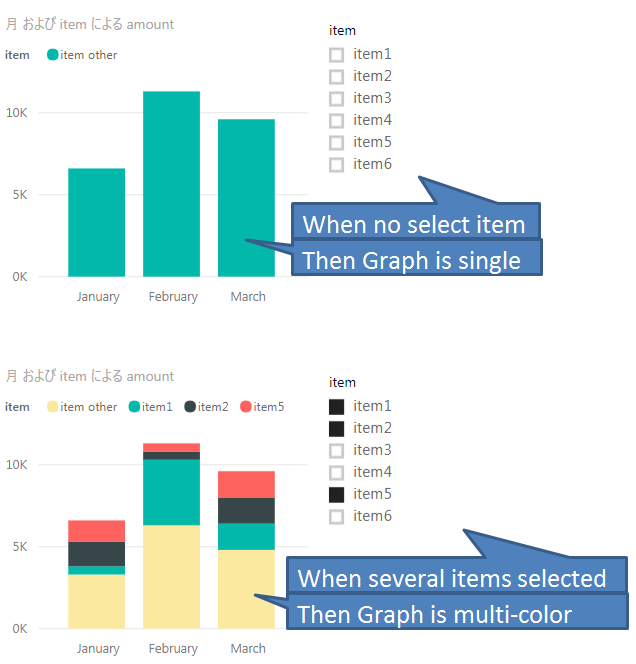
I want color Separated Graph by user selected item.
When no select item Then bar Graph is single color,
When several items selected Then bar Graph is multi-color.
Is this possible?
Solved! Go to Solution.
Hi @hrkasno,
For your requirement, we can not achieve it to date. If nothing is selected by the slicer, the graph will be splited by all items, we can not set the default value. Please comment on the ideas below.
Slicer default selected values
Default Selected Slicer or Tile-By Value Configuration
Best Regards,
Angelia
Hi @hrkasno,
Please add the [item] column as Legend level. It will show as your second screenshot displayed.
Best Regards,
Angelia
Hi, @v-huizhn-msft
thank you for answering
When you add the [item] column as a legend level, it is always split by [item].
But this is not what I want.
If nothing is selected by the slicer, it becomes a graph of a single color,
When choosing with a slicer, I want to divide it by that [item].
Is it possible.
Hi @hrkasno,
For your requirement, we can not achieve it to date. If nothing is selected by the slicer, the graph will be splited by all items, we can not set the default value. Please comment on the ideas below.
Slicer default selected values
Default Selected Slicer or Tile-By Value Configuration
Best Regards,
Angelia
Join us in Barcelona for FabCon and SQLCon, the Fabric, Power BI, SQL, and AI community event. Save €200 with code FABCMTY200.
Join Data Days 2026: 60 days of free live/on-demand sessions, challenges, study groups, and certification opportunities.
| User | Count |
|---|---|
| 28 | |
| 26 | |
| 26 | |
| 20 | |
| 16 |
| User | Count |
|---|---|
| 51 | |
| 49 | |
| 43 | |
| 39 | |
| 36 |