Get certified for free when you join Fabric Data Days 2026 and dive into Fabric, Power BI, SQL, AI, and other essential data skills.
Join nowJuly 7 - July 17 | Round 2 of the Power BI Dataviz World Championships. Don't miss your chance! Learn more
Hi all,
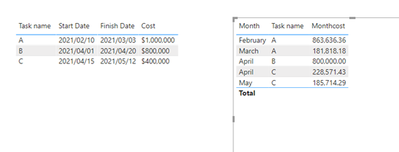
I have a dataset connected to the project online and schedule including many tasks. I am trying to make a monthly cashflow graph but I don't know how to split the costs between months. please see the below
for an example
I have this table. imaging the cost has been distributed equally in days. for example Task B each day has 40,000$.
| Task name | Start Date | Finish Date | Cost |
| A | 10/02/2021 | 30/03/2021 | $1,000,000 |
| B | 1/04/2021 | 20/04/2021 | $800,000 |
| C | 15/04/2021 | 12/05/2021 | $400,000 |
How can I show monthly cashflow??
Solved! Go to Solution.
Hi @Anonymous,
If this meet your need:
Here is the demo, please try it: Cashflow presentation
Best Regards
Link
If this post helps then please consider Accept it as the solution to help the other members find it more quickly.
Hi @Anonymous,
If this meet your need:
Here is the demo, please try it: Cashflow presentation
Best Regards
Link
If this post helps then please consider Accept it as the solution to help the other members find it more quickly.
Thanks for that, I commented on that post
@Anonymous , refer my blog on a similar topic can help
Also find attached find for allocation approch
Join us in Barcelona for FabCon and SQLCon, the Fabric, Power BI, SQL, and AI community event. Save €200 with code FABCMTY200.
If you love stickers, then you will definitely want to check out our community sticker challenge, Barcelona edition!
Check out the July 2026 Power BI update to learn about new features.
| User | Count |
|---|---|
| 30 | |
| 23 | |
| 23 | |
| 23 | |
| 14 |
| User | Count |
|---|---|
| 46 | |
| 33 | |
| 20 | |
| 18 | |
| 16 |