
cancel
Showing results for 
Search instead for 
Did you mean: 

July 7 - July 17 | Round 2 of the Power BI Dataviz World Championships. Don't miss your chance! Learn more

Reply
tchosas
Regular Visitor

Cascade Graph

Screenshot_1.png

Instead of showing the cascade columns with the sectioned data, I would like to show the accumulated data (as shown in the image). How can I do this?

4 REPLIES 4
v-yuta-msft
Community Support
Community Support

@tchosas ,


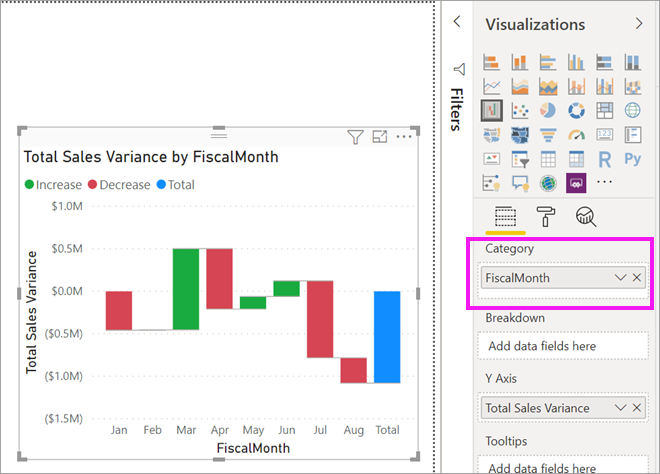
Have you tried waterfall chart?

power-bi-waterfall-month.png 


Reference:

https://docs.microsoft.com/en-us/power-bi/visuals/power-bi-visualization-waterfall-charts


Community Support Team _ Jimmy Tao

If this post helps, then please consider Accept it as the solution to help the other members find it more quickly.


parry2k
Super User
Super User

@tchosas how does your sample data looks like? What is on x-axis? are you using a measure for %?


Subscribe to the @PowerBIHowTo YT channel for an upcoming video on List and Record functions in Power Query!!

Learn Power BI and Fabric - subscribe to our YT channel - Click here: @PowerBIHowTo

If my solution proved useful, I'd be delighted to receive Kudos. When you put effort into asking a question, it's equally thoughtful to acknowledge and give Kudos to the individual who helped you solve the problem. It's a small gesture that shows appreciation and encouragement! ❤


Did I answer your question? Mark my post as a solution. Proud to be a Super User! Appreciate your Kudos 🙂
Feel free to email me with any of your BI needs.

Screenshot_1.png


Hello, @v-yuta-msft , i'm actually using waterfall chart.

Hello, @Anonymous, the category is date range in days of payments(0-5 days, 5-10 days, etc.), and the y-axis is a count of how many payments were made in each date range.

@tchosas we need to create the running total  of % to make it work. can you share sample pbix file so that I can get you the solution. Remove any sensitive information before sharing.


Subscribe to the @PowerBIHowTo YT channel for an upcoming video on List and Record functions in Power Query!!

Learn Power BI and Fabric - subscribe to our YT channel - Click here: @PowerBIHowTo

If my solution proved useful, I'd be delighted to receive Kudos. When you put effort into asking a question, it's equally thoughtful to acknowledge and give Kudos to the individual who helped you solve the problem. It's a small gesture that shows appreciation and encouragement! ❤


Did I answer your question? Mark my post as a solution. Proud to be a Super User! Appreciate your Kudos 🙂
Feel free to email me with any of your BI needs.

Helpful resources

Announcements
FabCon and SQLCon Barcelona 2026

FabCon & SQLCon – Barcelona 2026

Join us in Barcelona for FabCon and SQLCon, the Fabric, Power BI, SQL, and AI community event. Save €200 with code FABCMTY200.

60 days of Data Days Carousel

Data Days 2026

Join Fabric Data Days 2026: 60 days of free live/on-demand sessions, challenges, study groups, and certification opportunities.

Power BI DataViz World Championships carousel

Power BI DataViz World Championships - June 2026

A new Power BI DataViz World Championship is coming this June! Don't miss out on submitting your entry.

Top Solution Authors