cancel
Showing results for 
Search instead for 
Did you mean: 

July 7 - July 17 | Round 2 of the Power BI Dataviz World Championships. Don't miss your chance! Learn more

Reply
trulynaveen
Frequent Visitor

Cardinality/Relationship Issue

https://tacoteam-my.sharepoint.com/:x:/g/personal/njonnalagadda_tacometals_com/ES--F9WiuqRGkOrsmHxa8... 


Hello everyone,


I'm trying to build a variance report on Power BI and I'm stuck here in building relationships with the two tables. I would much appreciate if you could give me the right direction to get my desired output.


I have two tables Date-Dup which has Department and Date wise budget minutes, I would like to compare this table with Jobs Table which has total minutes by datee


This is the desired output I'm trying to get on BI as of 1/27/2020:


NewJobClassTotal MinutesBudget Minutes
SEA5946856764.8


Password to the file: BI2020


1 ACCEPTED SOLUTION

Hi, change the measure to this:

Actual Minutes =
IF(HASONEVALUE(DateDup[DeptName]),
SUMX(FILTER(JobsData, JobsData[NewJobClass] = SELECTEDVALUE(DateDup[DeptName])), [Total Minutes]), SUM(JobsData[Total Minutes))

This was typed on phone so forgive any typos.
For your graph question, that is a whole new requirement, please open a separate topic for that question with all necessary information so my peers can have a look at that as well:)


Did I answer your question? Mark my post as a solution!

Proud to be a Super User!


View solution in original post

5 REPLIES 5
v-kelly-msft
Community Support
Community Support

Hi @trulynaveen


Try the following measures:


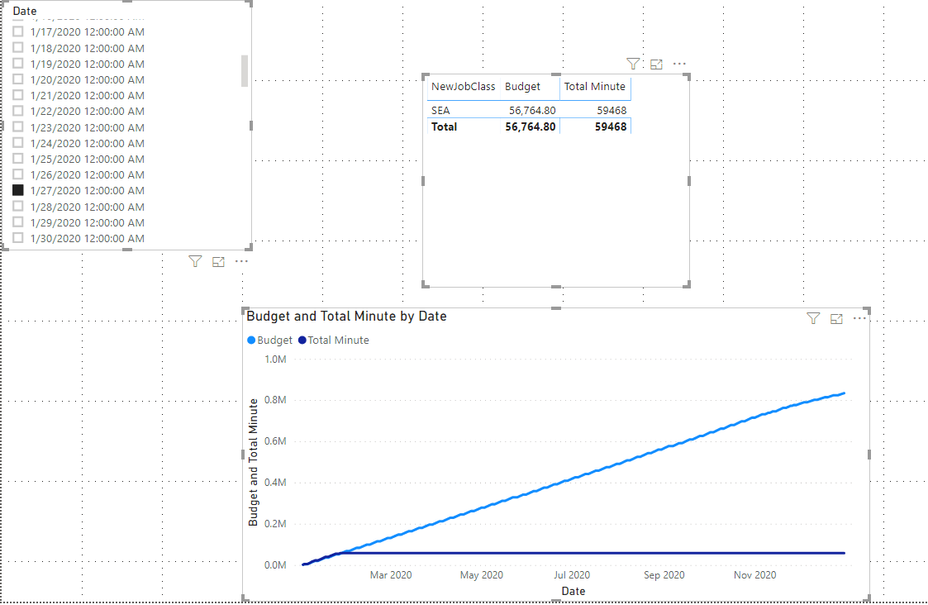
Budget = CALCULATE(SUM('Date-Dup'[Budget Minutes]),FILTER(ALLSELECTED('Date-Dup'),'Date-Dup'[Date]<= MIN('Date'[Date])))
Total Minute = CALCULATE(SUM('JobsData'[Total Minutes]),FILTER(ALLSELECTED('JobsData'),'JobsData'[EntryDate]<=MIN('Date'[Date])))


And you will see :


Annotation 2020-01-28 155105.png


For the related .pbix file,pls click here.


Best Regards,
Kelly

JarroVGIT
Resident Rockstar
Resident Rockstar

Hi @trulynaveen ,

This can be accomplished without an active relationship. I loaded your data into PBI (big thank you for providing data, that really helps us helping you!) and created the following measures:

Budgeted Minutes = SUMX(FILTER(DateDup, DateDup[Date] <= TODAY()), [Budget Minutes])
Actual Minutes = 
SUMX(FILTER(JobsData, JobsData[NewJobClass] = SELECTEDVALUE(DateDup[DeptName])), [Total Minutes])

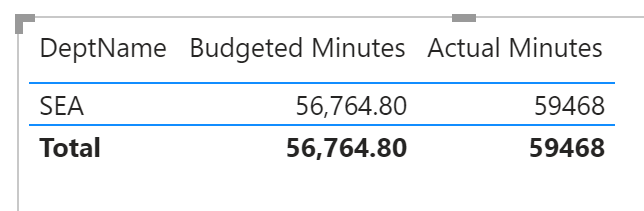
Then I created a table visual and put in the column DateDup[DeptName] and the two measures, resulting in this:

image.png

Does this answer you question?


Kind regards

Djerro123

-------------------------------

If this answered your question, please mark it as the Solution. This also helps others to find what they are looking for.

Keep those thumbs up coming! 🙂


Did I answer your question? Mark my post as a solution!

Proud to be a Super User!


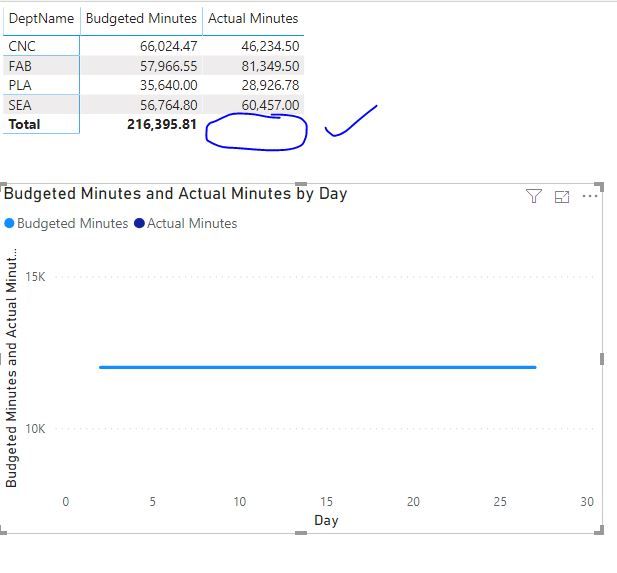
Thank you so much for the help. I just refreshed my data and wide opened to other departments by removing additional filters,now looks like your formula has worked. But I couldn't see the grand total under actual minutes. 


Also, is there anyway we can put this on a Line Chart using CalendarAuto()?


Capture.JPG

 Best,

Naveen

Hi, change the measure to this:

Actual Minutes =
IF(HASONEVALUE(DateDup[DeptName]),
SUMX(FILTER(JobsData, JobsData[NewJobClass] = SELECTEDVALUE(DateDup[DeptName])), [Total Minutes]), SUM(JobsData[Total Minutes))

This was typed on phone so forgive any typos.
For your graph question, that is a whole new requirement, please open a separate topic for that question with all necessary information so my peers can have a look at that as well:)


Did I answer your question? Mark my post as a solution!

Proud to be a Super User!


This worked for me!

Helpful resources

Announcements
FabCon and SQLCon Barcelona 2026

FabCon & SQLCon – Barcelona 2026

Join us in Barcelona for FabCon and SQLCon, the Fabric, Power BI, SQL, and AI community event. Save €200 with code FABCMTY200.

60 days of Data Days Carousel

Data Days 2026

Join Data Days 2026: 60 days of free live/on-demand sessions, challenges, study groups, and certification opportunities.

Power BI DataViz World Championships carousel

Power BI DataViz World Championships - June 2026

A new Power BI DataViz World Championship is coming this June! Don't miss out on submitting your entry.

Top Solution Authors
Top Kudoed Authors