Get certified for free when you join Fabric Data Days 2026 and dive into Fabric, Power BI, SQL, AI, and other essential data skills.
Join nowJuly 28 - August 9 | Final Round of the Power BI Dataviz World Championships. This is your chance. Learn more
I want to calculate one total weighted average based on all entries in a table that responds to user selected filters on the table.
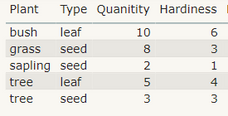
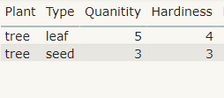
In these tables the quantity is the weight and hardiness is the base value.
So for table 1 the weighted avg would be 4.1785
But for table 2 the overall average would be 3.625
How could I show a weighted average for all fields in a filtered table?
Solved! Go to Solution.
Hi @Anonymous ,
Assuming I have your logic right - I think the answer you are expecting is 4.107 when nothing is selected? If so the following should work.
Weighted Avg =
Var Plantvalue = SUMX(Plants, Plants[Quantity]*Plants[Hardiness ])
Var Quantity = SUM(Plants[Quantity])
Var result = Plantvalue / Quantity
Return
result
Hi @Anonymous ,
Assuming I have your logic right - I think the answer you are expecting is 4.107 when nothing is selected? If so the following should work.
Weighted Avg =
Var Plantvalue = SUMX(Plants, Plants[Quantity]*Plants[Hardiness ])
Var Quantity = SUM(Plants[Quantity])
Var result = Plantvalue / Quantity
Return
result
Sorry, I'm not super familiar with PowerBI is that a DAX function? Where would I use that?
I think I figured it out. I'm assuming that it would be put into a new measure 🙂
Hi @Anonymous, sorry should have stated in my original message! Yes it's a new measure.
Hope the measure helped, if it addressed your problem please mark it as a solution!
If you love stickers, then you will definitely want to check out our community sticker challenge, Barcelona edition!
Check out the July 2026 Power BI update to learn about new features.
| User | Count |
|---|---|
| 30 | |
| 28 | |
| 23 | |
| 21 | |
| 19 |
| User | Count |
|---|---|
| 40 | |
| 31 | |
| 18 | |
| 18 | |
| 15 |