FabCon is coming to Atlanta
Join us at FabCon Atlanta from March 16 - 20, 2026, for the ultimate Fabric, Power BI, AI and SQL community-led event. Save $200 with code FABCOMM.
Register now!- Power BI forums
- Get Help with Power BI
- Desktop
- Service
- Report Server
- Power Query
- Mobile Apps
- Developer
- DAX Commands and Tips
- Custom Visuals Development Discussion
- Health and Life Sciences
- Power BI Spanish forums
- Translated Spanish Desktop
- Training and Consulting
- Instructor Led Training
- Dashboard in a Day for Women, by Women
- Galleries
- Data Stories Gallery
- Themes Gallery
- Contests Gallery
- QuickViz Gallery
- Quick Measures Gallery
- Visual Calculations Gallery
- Notebook Gallery
- Translytical Task Flow Gallery
- TMDL Gallery
- R Script Showcase
- Webinars and Video Gallery
- Ideas
- Custom Visuals Ideas (read-only)
- Issues
- Issues
- Events
- Upcoming Events
The Power BI Data Visualization World Championships is back! It's time to submit your entry. Live now!
- Power BI forums
- Forums
- Get Help with Power BI
- Desktop
- Re: Calculating Rolling Measure
- Subscribe to RSS Feed
- Mark Topic as New
- Mark Topic as Read
- Float this Topic for Current User
- Bookmark
- Subscribe
- Printer Friendly Page
- Mark as New
- Bookmark
- Subscribe
- Mute
- Subscribe to RSS Feed
- Permalink
- Report Inappropriate Content
Calculating Rolling Measure
Hi,
I have a table which displays how many people are in each department at the end of every month.
I'm looking at creating a rolling 12 month measure that gives you the average amount of people across all departments for the past 12 months. (i.e. a headcount).
I've tried using the below formula but it is giving me values of around 9 and 10 for the most recent 12 months as a example, when that number should be around 300:
Rolling12mAvHeadcount = CALCULATE(AVERAGE(DeptHC[Headcount]),DATESINPERIOD(DeptHC[MonthPT],LASTDATE(DeptHC[MonthPT]),-12,MONTH))
I'm sure I've almost cracked it, just some guidance would be fantastic.
Thanks

- Mark as New
- Bookmark
- Subscribe
- Mute
- Subscribe to RSS Feed
- Permalink
- Report Inappropriate Content
Bhavesh
Love the Self Service BI.
Please use the 'Mark as answer' link to mark a post that answers your question. If you find a reply helpful, please remember to give Kudos.
- Mark as New
- Bookmark
- Subscribe
- Mute
- Subscribe to RSS Feed
- Permalink
- Report Inappropriate Content
Hi @BhaveshPatel thanks very much for your response.
On the second last line of your formula, do you need a SUM or AVERAGE function before you name [DEPTHC HEADCOUNT]?
Thanks
- Mark as New
- Bookmark
- Subscribe
- Mute
- Subscribe to RSS Feed
- Permalink
- Report Inappropriate Content
It should be average as you are calculating AVERAGE.
Bhavesh
Love the Self Service BI.
Please use the 'Mark as answer' link to mark a post that answers your question. If you find a reply helpful, please remember to give Kudos.
- Mark as New
- Bookmark
- Subscribe
- Mute
- Subscribe to RSS Feed
- Permalink
- Report Inappropriate Content
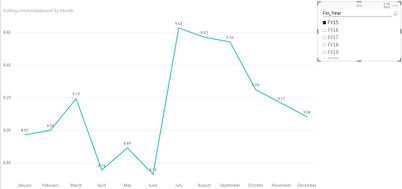
Ok, your equation appears to be averaging the headcount against the departments though, instead of averaging the amount of people overall (Should be around 300 average, as opposed to 9). Hopefully you can see in the screenshot below.
- Mark as New
- Bookmark
- Subscribe
- Mute
- Subscribe to RSS Feed
- Permalink
- Report Inappropriate Content
Sorry for late reply. Send me the test file and will fix the issue for you.
Bhavesh
Love the Self Service BI.
Please use the 'Mark as answer' link to mark a post that answers your question. If you find a reply helpful, please remember to give Kudos.
Helpful resources
| User | Count |
|---|---|
| 51 | |
| 37 | |
| 31 | |
| 21 | |
| 19 |
| User | Count |
|---|---|
| 138 | |
| 102 | |
| 59 | |
| 36 | |
| 35 |


