FabCon is coming to Atlanta
Join us at FabCon Atlanta from March 16 - 20, 2026, for the ultimate Fabric, Power BI, AI and SQL community-led event. Save $200 with code FABCOMM.
Register now!- Power BI forums
- Get Help with Power BI
- Desktop
- Service
- Report Server
- Power Query
- Mobile Apps
- Developer
- DAX Commands and Tips
- Custom Visuals Development Discussion
- Health and Life Sciences
- Power BI Spanish forums
- Translated Spanish Desktop
- Training and Consulting
- Instructor Led Training
- Dashboard in a Day for Women, by Women
- Galleries
- Data Stories Gallery
- Themes Gallery
- Contests Gallery
- Quick Measures Gallery
- Notebook Gallery
- Translytical Task Flow Gallery
- TMDL Gallery
- R Script Showcase
- Webinars and Video Gallery
- Ideas
- Custom Visuals Ideas (read-only)
- Issues
- Issues
- Events
- Upcoming Events
To celebrate FabCon Vienna, we are offering 50% off select exams. Ends October 3rd. Request your discount now.
- Power BI forums
- Forums
- Get Help with Power BI
- Desktop
- Calculate subtotal based on multiple slicer
- Subscribe to RSS Feed
- Mark Topic as New
- Mark Topic as Read
- Float this Topic for Current User
- Bookmark
- Subscribe
- Printer Friendly Page
- Mark as New
- Bookmark
- Subscribe
- Mute
- Subscribe to RSS Feed
- Permalink
- Report Inappropriate Content
Calculate subtotal based on multiple slicer
Dear Experts,
Good Day, hope you are doing good.
Ok, my requirement is quiet different or unusual, we are in a process of replicating the SSRS tabular reports in Power BI, most of the features were achieved and got stuck in this one, I am not that good in DAX, only the basic I know. so, let me come to the point
Requirement:
1) There are 5 slicers namely Group1,Group2,Group3,Group4,Group5
additional info about slicer >> all are single select slicers >> one slicer value will not be displayed in the other. >> Slicer colum is from an independent table which has "No Relationship" with any other data tables.
2) User will randomly select the values from each slicer >> based on this selection, I need to calculate the subtotal for a financial column
Sample Dataset and the Expected result as per the image below.
let me give you a brieff on the above image,
> I have taken the US population by state
> Added two slicer for example purpose
> Selected "Country" from Slicer#1 and "State" from Slicer#2
> As per the above selection, expected output is given on the right side of the image. (coloured table)
I also created measure like this
Measeure =
Solved! Go to Solution.
- Mark as New
- Bookmark
- Subscribe
- Mute
- Subscribe to RSS Feed
- Permalink
- Report Inappropriate Content
Hi, @Prabhu_MDU ;
You could try to change the measure as follows:
Payment =
CALCULATE (
    SUM ( [Payment] ),
    FILTER (
        'Table',
        [Company] = MAX ( Slicer1[Group1_Column] )
            && [External] = MAX ( Slicer2[Group2_Column] )
            && [Process Center] = MAX ( Slicer3[Group3_Column] )
            && [State Name] = MAX ( Slicer4[Group4_Column] )))
Best Regards,
Community Support Team_ Yalan Wu
If this post helps, then please consider Accept it as the solution to help the other members find it more quickly.
- Mark as New
- Bookmark
- Subscribe
- Mute
- Subscribe to RSS Feed
- Permalink
- Report Inappropriate Content
My humble apologies for the delay in reply.. (all the notification mails went in junk folder, extremely sorry about it).
Hearty thanks for your great effort @v-yalanwu-msft .. you are much closer to my requirement. but it is not exactly the same. (really sorry)..
here is the power example for what I am looking for.
good news is, I am able to bring the expected value using SWITCH. but it is too costly in performance it seems. taking lot of rendering time when I implement the same logic in the real time file.
please download this sample pbix file and have a look, defenitely it can be easy to help me with this example file.
I apologies if I am not clear in giving the requirement.
looking forward to hear from you..
https://drive.google.com/file/d/1DzZH6kRiuMaLDDkplW86np4XpTGVJYq0/view?usp=sharing
- Mark as New
- Bookmark
- Subscribe
- Mute
- Subscribe to RSS Feed
- Permalink
- Report Inappropriate Content
Hi, @Prabhu_MDU ;
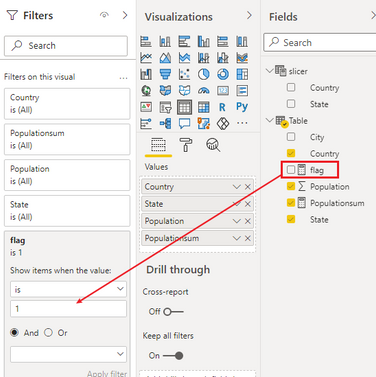
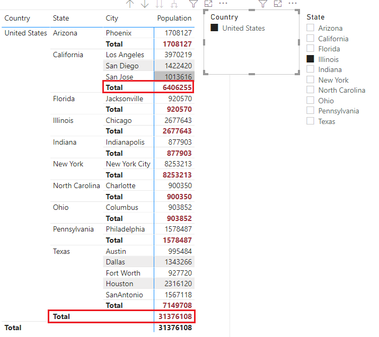
According to your description, if you use table to show it ,you could create a measure to calculate sum of state, and create a flag to filter it ; if you use matrix to show it, you only create a flag measure to filter .
Table:
a)create a measure to calculate sum
Populationsum = CALCULATE(SUM([Population]),ALLEXCEPT('Table','Table'[Country ],'Table'[State]))b)create a flag measure
flag =
var _ccountry=SUMMARIZE('slicer',[Country ])
return IF(MAX([Country ]) in _ccountry||MAX([State])=MAX('slicer'[State]),1,0)
c)put flag measure into filter.
The final output is shown below:
Matrix:
a)create a flag measure
flag = var _ccountry=SUMMARIZE('slicer',[Country ])
return IF(MAX([Country ]) in _ccountry||MAX([State])=MAX('slicer'[State]),1,0)
b)put it into filter.
The final output is shown below:
Best Regards,
Community Support Team_ Yalan Wu
If this post helps, then please consider Accept it as the solution to help the other members find it more quickly.
- Mark as New
- Bookmark
- Subscribe
- Mute
- Subscribe to RSS Feed
- Permalink
- Report Inappropriate Content
Hi @v-yalanwu-msft ,
Thanks for your valuable reply and great effort. the solution is exactly what I am looking for, but in your (as per my sample data) example it is static, but in my real scenario it will be dynamic.
You have got the requirement exactly. but how the same can be achieved dynamically. thats the challenge I am facing.
I Cannot define directly as
CALCULATE(SUM([Payment]) , ALLEXCEPT([Company],[External],[Process Center],[State Name]))because the "ALLEXCEPT" columns will be selected by the user using the slicer. So, I need to say define it like this
CALCULAT(SUM([Payment]) , ALLEXCEPT(
SELECTEDVALUE(Slicer1[Group1_Column])="Company",[Company],
SELECTEDVALUE(Slicer2[Group2_Column])="External",[External],
SELECTEDVALUE(Slicer3[Group3_Column])="Process Center",[Process Center],
SELECTEDVALUE(Slicer4[Group4_Column])="State Name",[State Name]))
(this is not the right measure, but the idea is the same), here it becomes dynamic based on the selected value from each slicer. I believe my description is even more elaborate for you.
In the above screenshort, there are totally 9 Columns, out of the 9, 8 will be given as a dropdown in slicers as shown in the image, each slicer value is from each different table and they are independent tables (no relationship created), the slicers are set to "Single Selection" mode "On", as per the user choice from dropdown in each slicers, we will get 4 columns, based on this 4 random columns, I need to calculate the sum of "Payment" the last column. please help me to fix this.
Note: I am sorry, unable to attach the sample power Bi,
- Mark as New
- Bookmark
- Subscribe
- Mute
- Subscribe to RSS Feed
- Permalink
- Report Inappropriate Content
Hi, @Prabhu_MDU ;
You could try to change the measure as follows:
Payment =
CALCULATE (
    SUM ( [Payment] ),
    FILTER (
        'Table',
        [Company] = MAX ( Slicer1[Group1_Column] )
            && [External] = MAX ( Slicer2[Group2_Column] )
            && [Process Center] = MAX ( Slicer3[Group3_Column] )
            && [State Name] = MAX ( Slicer4[Group4_Column] )))
Best Regards,
Community Support Team_ Yalan Wu
If this post helps, then please consider Accept it as the solution to help the other members find it more quickly.
- Mark as New
- Bookmark
- Subscribe
- Mute
- Subscribe to RSS Feed
- Permalink
- Report Inappropriate Content
@Prabhu_MDU , if you are using slicer on country and state which below to same tbale you are putting up filter, they are automatically filter with and (&&) without you doing that
'Table'[Country]=MIN('Table'[Country]) ||
'Table'[State]=MIN('Table'[State])
This just doing row context comparision
with independent tables state and country or can work
Measeure =
CALCULATE(
SUM('Table'[Population]),
FILTER(('Table'),
'Table'[Country]=selectedvalue('Country'[Country]) ||
'Table'[State]=selectedvalue('State'[State])
)
)
)
Need of an Independent Table in Power BI: https://youtu.be/lOEW-YUrAbE
- Mark as New
- Bookmark
- Subscribe
- Mute
- Subscribe to RSS Feed
- Permalink
- Report Inappropriate Content
Hi @amitchandak ,
My hearrty thanks for your reply,
This is working same as how my measure works, i.e it is not grouping the values from slicers which is treated as column here . I mean, it is not grouping the columns as like
Sum(Population) GroupBy (Country,State). It is grouping all the columns, here as per the example Country,State,City,Sum(Population).
Please help me to fix this.


