Join us in Barcelona for FabCon and SQLCon, September 28 - October 1, 2026.
This is best Fabric, Power BI, SQL and AI community event. How do we know? The last event sold out! Save €200 with code FABCMTY200.
Register now- Power BI forums
- Get Help with Power BI
- Desktop
- Service
- Report Server
- Power Query
- Mobile Apps
- Developer
- DAX Commands and Tips
- Custom Visuals Development Discussion
- Health and Life Sciences
- Power BI Spanish forums
- Translated Spanish Desktop
- Training and Consulting
- Instructor Led Training
- Dashboard in a Day for Women, by Women
- Galleries
- Data Stories Gallery
- Themes Gallery
- Contests Gallery
- QuickViz Gallery
- Quick Measures Gallery
- Visual Calculations Gallery
- Fabric Apps Gallery
- Notebook Gallery
- Translytical Task Flow Gallery
- TMDL Gallery
- R Script Showcase
- Webinars and Video Gallery
- Ideas
- Custom Visuals Ideas (read-only)
- Issues
- Issues
- Events
- Upcoming Events
The Fabric community is upgrading! Read all of the details including the timeline and what you can expect. Learn more
- Power BI forums
- Forums
- Get Help with Power BI
- Desktop
- Re: Calculate difference between two rows by using...
- Subscribe to RSS Feed
- Mark Topic as New
- Mark Topic as Read
- Float this Topic for Current User
- Bookmark
- Subscribe
- Printer Friendly Page

- Mark as New
- Bookmark
- Subscribe
- Mute
- Subscribe to RSS Feed
- Permalink
- Report Inappropriate Content
Calculate difference between two rows by using Index column
Hi al,
I know this question has been asked before, but I tried them all and wasn't able to compete. Sorry!
I've got the below table (4 colums) within Power BI (just created a table in Excel to edit values). I would like to calculate the difference between values in column "Kilometers".
The calculation should only be applied for rows with the same value for column "Reference", so I guess we need to calculate the difference between a row and a row where [Index] = ([Index] -1) ?
Anybody got any tips on the DAX or Power Query code to be applied? I've created a column "Expected result" in Excel, just to clarify things.
Thanks in advance!
Solved! Go to Solution.


- Mark as New
- Bookmark
- Subscribe
- Mute
- Subscribe to RSS Feed
- Permalink
- Report Inappropriate Content
try this
Column =
VAR Index = 'Table'[Index]
VAR Reference = 'Table'[Reference]
VAR PrevKilometers =
    CALCULATE (
        FIRSTNONBLANK ( 'Table'[Kilometers], TRUE () ),
        FILTER ( 'Table', 'Table'[Index] = Index - 1 && 'Table'[Reference] = Reference )
    )
RETURN
    IF (
        ISBLANK ( PrevKilometers ),
        BLANK (),
        'Table'[Kilometers] - PrevKilometers
    )
Thank you for the kudos 🙂
- Mark as New
- Bookmark
- Subscribe
- Mute
- Subscribe to RSS Feed
- Permalink
- Report Inappropriate Content
try this
Column =
VAR Index = 'Table'[Index]
VAR Reference = 'Table'[Reference]
VAR PrevKilometers =
    CALCULATE (
        FIRSTNONBLANK ( 'Table'[Kilometers], TRUE () ),
        FILTER ( 'Table', 'Table'[Index] = Index - 1 && 'Table'[Reference] = Reference )
    )
RETURN
    IF (
        ISBLANK ( PrevKilometers ),
        BLANK (),
        'Table'[Kilometers] - PrevKilometers
    )
Thank you for the kudos 🙂
- Mark as New
- Bookmark
- Subscribe
- Mute
- Subscribe to RSS Feed
- Permalink
- Report Inappropriate Content
Hello Mr. Stachu,
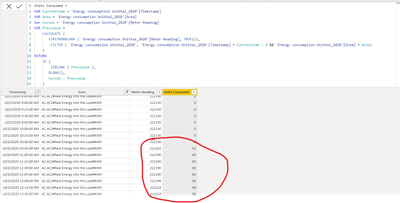
I tried the above formula and it returned the incorrect values. All the valules in the column are taking the first value as a reference. Please find the attached image for the reference.
- Mark as New
- Bookmark
- Subscribe
- Mute
- Subscribe to RSS Feed
- Permalink
- Report Inappropriate Content
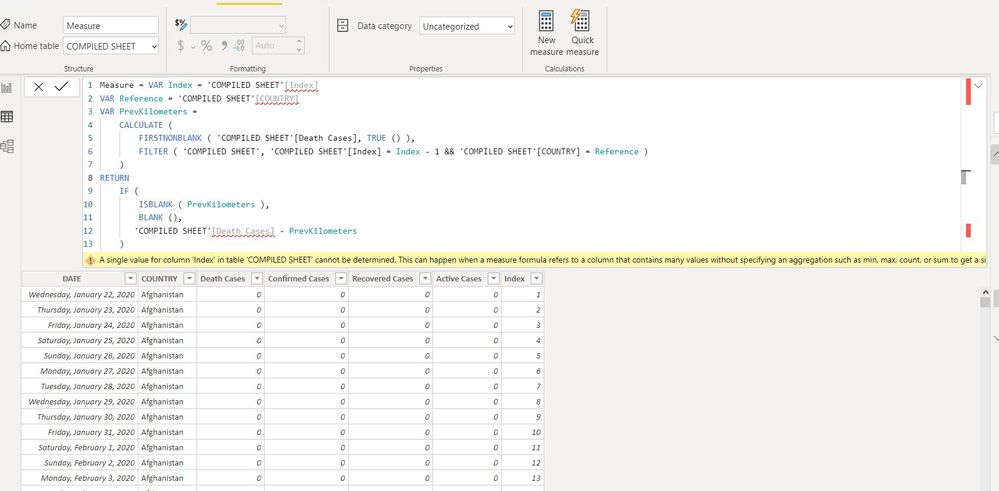
based on the formula provided below i have done on my data set but error is coming. kinldy guide me urgently.
- Mark as New
- Bookmark
- Subscribe
- Mute
- Subscribe to RSS Feed
- Permalink
- Report Inappropriate Content
I want to know the incremental number of column
Death Cases, confirmed Cases,Recovered CAses, Active Cases.
- Mark as New
- Bookmark
- Subscribe
- Mute
- Subscribe to RSS Feed
- Permalink
- Report Inappropriate Content
@usmanaziz you try to create a measure, the code you posted will only work as a calculated column
Thank you for the kudos 🙂
- Mark as New
- Bookmark
- Subscribe
- Mute
- Subscribe to RSS Feed
- Permalink
- Report Inappropriate Content
How can I adjust your formula to include data also as a criteria ?
i.e.,compare the values between current timestamp and previous time stamp,say 17-08-2019,10:25 P.M and 17-08-2019,10:30 P.M.
I have an ID Field and the glucose values,I should be capable of comparing the glucose_value,every now and then to indicate the episodes or spike in glucose level.
Thanks
- Mark as New
- Bookmark
- Subscribe
- Mute
- Subscribe to RSS Feed
- Permalink
- Report Inappropriate Content
the ID can be the same for multiple dates?
if yes then the difference in glucose for a given ID should be something like this:
Column =
VAR __ID = 'Table'[ID]
VAR __DateTime = 'Table'[DateTime]
VAR __PreviousDateTime =
    CALCULATE (
        MAX ( 'Table'[DateTime] ),
        FILTER ( 'Table', 'Table'[ID] = __ID && 'Table'[DateTime] < __DateTime)
    )
VAR __PreviousGlucose =
    CALCULATE (
        MAX ( 'Table'[Glucose] ),
        FILTER ( 'Table', 'Table'[ID] = __ID && 'Table'[DateTime] = __PreviousDateTime)
    )
RETURN
    IF (
        ISBLANK ( __PreviousDateTime ),
        BLANK (),
        'Table'[Glucose] - __PreviousGlucose
    )
Thank you for the kudos 🙂
- Mark as New
- Bookmark
- Subscribe
- Mute
- Subscribe to RSS Feed
- Permalink
- Report Inappropriate Content

- Mark as New
- Bookmark
- Subscribe
- Mute
- Subscribe to RSS Feed
- Permalink
- Report Inappropriate Content
Hi @Wickin
The image attached is not visible.
It would be great if you provide the Excel with dummy data.
Regards,
Suguna.
Helpful resources

FabCon & SQLCon – Barcelona 2026
Join us in Barcelona for FabCon and SQLCon, the Fabric, Power BI, SQL, and AI community event. Save €200 with code FABCMTY200.

Power BI DataViz World Championships - June 2026
A new Power BI DataViz World Championship is coming this June! Don't miss out on submitting your entry.

| User | Count |
|---|---|
| 24 | |
| 22 | |
| 20 | |
| 18 | |
| 14 |


| User | Count |
|---|---|
| 44 | |
| 36 | |
| 23 | |
| 20 | |
| 20 |


