This is best Fabric, Power BI, SQL and AI community event. How do we know? The last event sold out! Save €200 with code FABCMTY200.
Register nowJuly 28 - August 9 | Final Round of the Power BI Dataviz World Championships. This is your chance. Learn more
Hi Everyone,
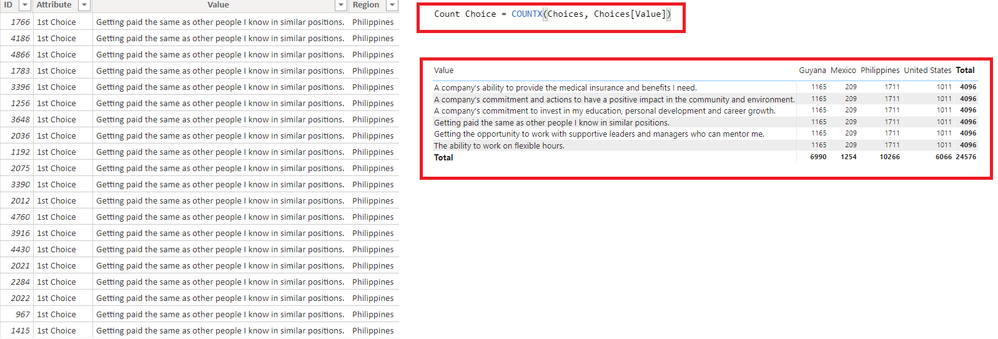
I'm having a hard time how to figure this out by counting the column Value by Region. As you can see below, total counts on each Value is the same.
Your help is greatly appreciated.
Table
@Anonymous
You can try this calculated column:
Column =
CALCULATE(DISTINCTCOUNT('Table'[Value]),FILTER(ALLSELECTED('Table'),'Table'[Region]=EARLIER('Table'[Region])))
Is your data formed through Unpivot Columns? You don’t need this step or you can display the results you need.
Can you share sample data and sample output in table format? Or a sample pbix after removing sensitive data.
Best Regards,
If this post helps, then please consider Accept it as the solution to help the other members find it more quickly
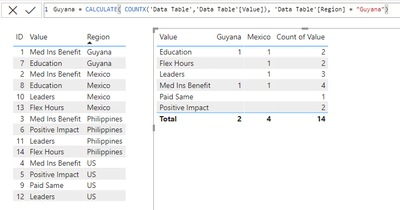
I think this is what you are trying to do...
Create a Measure for each Country, that will be the columns you need: (Examples - repeat for every country)
Here's the raw data and final result...
Proud to give back to the community!
Thank You!
Join us in Barcelona for FabCon and SQLCon, the Fabric, Power BI, SQL, and AI community event. Save €200 with code FABCMTY200.
If you love stickers, then you will definitely want to check out our community sticker challenge, Barcelona edition!
Check out the July 2026 Power BI update to learn about new features.
| User | Count |
|---|---|
| 25 | |
| 23 | |
| 19 | |
| 17 | |
| 14 |
| User | Count |
|---|---|
| 24 | |
| 20 | |
| 20 | |
| 19 | |
| 19 |