Get certified for free when you join Fabric Data Days 2026 and dive into Fabric, Power BI, SQL, AI, and other essential data skills.
Join nowJuly 7 - July 17 | Round 2 of the Power BI Dataviz World Championships. Don't miss your chance! Learn more
Hello everyone,
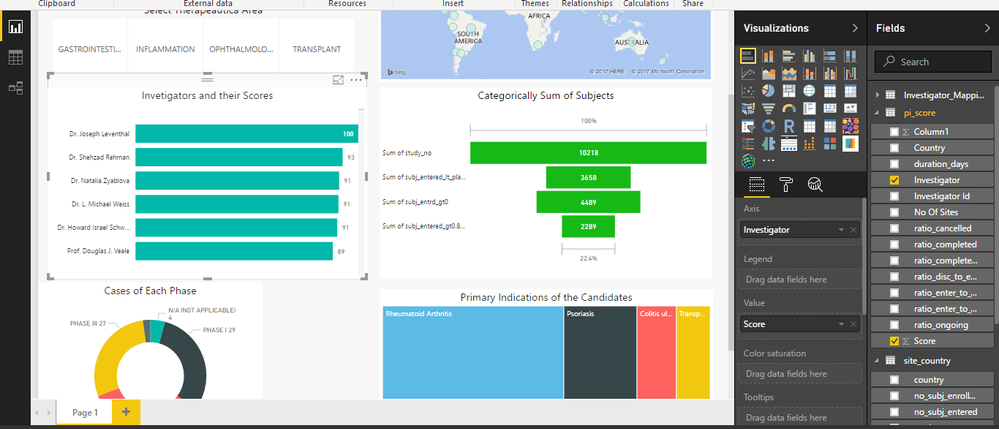
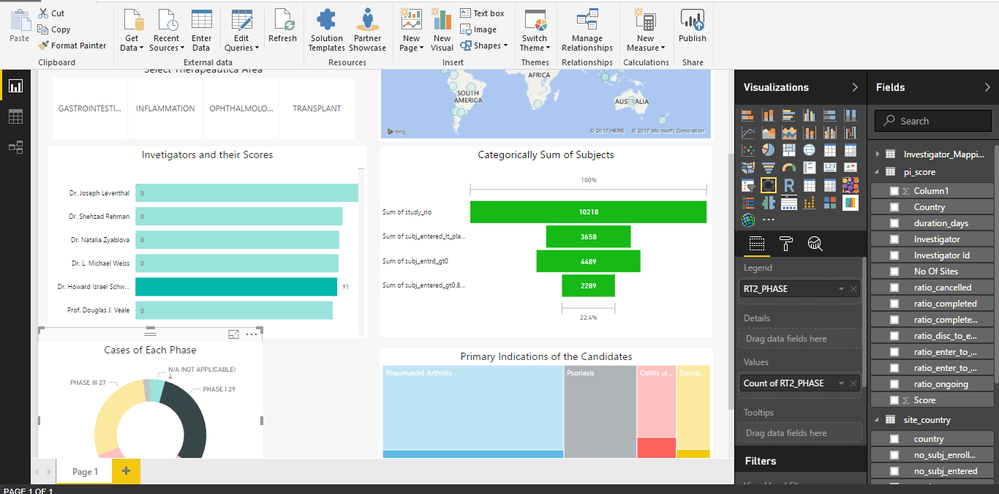
I have created a bar chart that conatins two columns : Investigators and their corresponding scores. It is sorted according to the scores from highest to lowest. What I want is that when the graph gets filtered as per my selection on some other chart then my bar chart should also get rearranged according to remaining scores, instead of showing 0's
Solved! Go to Solution.
Hi @Pulkit,
I don't know if this is what you are looking but if you select the format and edit interactions you can select how the visuals interact between thems.
https://powerbi.microsoft.com/en-us/documentation/powerbi-service-visual-interactions/
Regards,
MFelix
Regards
Miguel Félix
Proud to be a Super User!
Check out my blog: Power BI em PortuguêsHi @Pulkit,
I don't know if this is what you are looking but if you select the format and edit interactions you can select how the visuals interact between thems.
https://powerbi.microsoft.com/en-us/documentation/powerbi-service-visual-interactions/
Regards,
MFelix
Regards
Miguel Félix
Proud to be a Super User!
Check out my blog: Power BI em PortuguêsJoin us in Barcelona for FabCon and SQLCon, the Fabric, Power BI, SQL, and AI community event. Save €200 with code FABCMTY200.
Join Data Days 2026: 60 days of free live/on-demand sessions, challenges, study groups, and certification opportunities.
| User | Count |
|---|---|
| 28 | |
| 27 | |
| 25 | |
| 23 | |
| 17 |
| User | Count |
|---|---|
| 53 | |
| 46 | |
| 38 | |
| 30 | |
| 21 |