Hi @ven853,
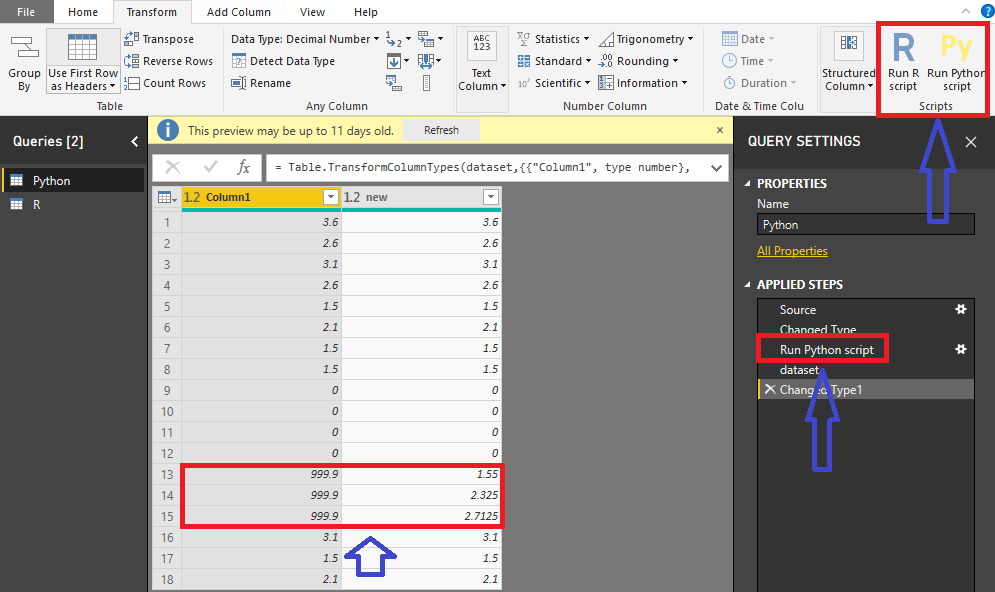
To be honest, it's hard to achieve it using Power Query. I would suggest you leverage the power of Python and R. I created a demo solution with both Python and R. You can choose the best one that suits you. You can download it from the attachment.
# 'dataset' holds the input data for this script

def find_next(excluded, ds):
    for item in ds:
        if item != excluded:
            return item
    return 0

result = []
column1 = dataset.iloc[:, 0]
for index in range(len(column1)):
    if column1[index] != 999.9:
        result.append(column1[index])
    else:
        next = find_next(999.9, column1[index + 1:])
        result.append((next + result[-1]) / 2)
dataset["new"] = result
# 'dataset' holds the input data for this script

find_next <- function(excluded, ds) {
    for (item in ds[,1]) {
        if (item != excluded) {
            return(item)
        }
    }
    return(0)
}

result <- c()
ds_length <- nrow(dataset)
for (index in 1: ds_length) {
    if (dataset[index, 1] == 999.9) {
        result[index] <- (tail(result, 1) + find_next(999.9, tail(dataset, -index))) / 2.0
    }
    else{
        result[index] <- dataset[index, 1]
    }
}
final <- data.frame(result)
Best Regards,
Dale
Community Support Team _ Dale
If this post helps, then please consider Accept it as the solution to help the other members find it more quickly.


